

📊 Technical Analysis (EURUSD – Daily Timeframe)
EURUSD is currently showing signs of a potential bearish continuation on the daily timeframe.
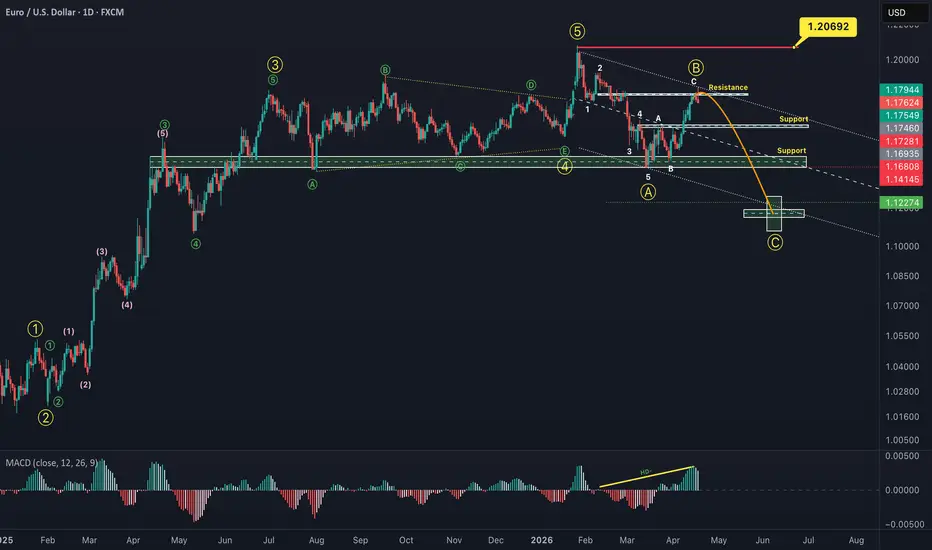
Based on Elliott Wave theory, wave B appears to have completed, and the market is now likely entering wave C, which typically unfolds with strong downward momentum. The structure resembles a zigzag correction (A-B-C).
Additionally, a hidden bearish divergence is visible, reinforcing the downside bias. Price has also reached a key resistance zone, increasing the probability of a reversal.
🔻 Bearish Scenario:
We expect a decline toward the 1.11923 – 1.11492 support zone.
❌ Invalidation Level:
If price breaks above 1.20692, this analysis will be invalidated.
🌍 Fundamental Analysis (Supporting Bias)
From a fundamental perspective, the bearish outlook for EURUSD is supported by several macroeconomic factors:
The Federal Reserve maintains a relatively hawkish stance, keeping interest rates elevated to combat inflation. This continues to support the US Dollar.
In contrast, the European Central Bank faces slower economic growth across the Eurozone, limiting its ability to remain aggressive with rate hikes.
Ongoing concerns about economic stagnation in Europe, especially in major economies like Germany, further weigh on the Euro.
Market sentiment currently favors the USD as a safe-haven asset, particularly amid global uncertainty.
📉 Conclusion:
Both technical and fundamental factors align in favor of a bearish move, supporting the expectation of wave C unfolding downward toward the specified support zone.
If you want, I can also format this into a shorter “TradingView caption style” or add entry/SL/TP levels.
EURUSD is currently showing signs of a potential bearish continuation on the daily timeframe.
Based on Elliott Wave theory, wave B appears to have completed, and the market is now likely entering wave C, which typically unfolds with strong downward momentum. The structure resembles a zigzag correction (A-B-C).
Additionally, a hidden bearish divergence is visible, reinforcing the downside bias. Price has also reached a key resistance zone, increasing the probability of a reversal.
🔻 Bearish Scenario:
We expect a decline toward the 1.11923 – 1.11492 support zone.
❌ Invalidation Level:
If price breaks above 1.20692, this analysis will be invalidated.
🌍 Fundamental Analysis (Supporting Bias)
From a fundamental perspective, the bearish outlook for EURUSD is supported by several macroeconomic factors:
The Federal Reserve maintains a relatively hawkish stance, keeping interest rates elevated to combat inflation. This continues to support the US Dollar.
In contrast, the European Central Bank faces slower economic growth across the Eurozone, limiting its ability to remain aggressive with rate hikes.
Ongoing concerns about economic stagnation in Europe, especially in major economies like Germany, further weigh on the Euro.
Market sentiment currently favors the USD as a safe-haven asset, particularly amid global uncertainty.
📉 Conclusion:
Both technical and fundamental factors align in favor of a bearish move, supporting the expectation of wave C unfolding downward toward the specified support zone.
If you want, I can also format this into a shorter “TradingView caption style” or add entry/SL/TP levels.

Disclaimer
The information and publications are not meant to be, and do not constitute, financial, investment, trading, or other types of advice or recommendations supplied or endorsed by TradingView. Read more in the Terms of Use.
Disclaimer
The information and publications are not meant to be, and do not constitute, financial, investment, trading, or other types of advice or recommendations supplied or endorsed by TradingView. Read more in the Terms of Use.