
As predicted in my last $EVAA analysis (quoted), it's time for some correction. I'm 70% out of this trade, closed very well above $10 and $12.
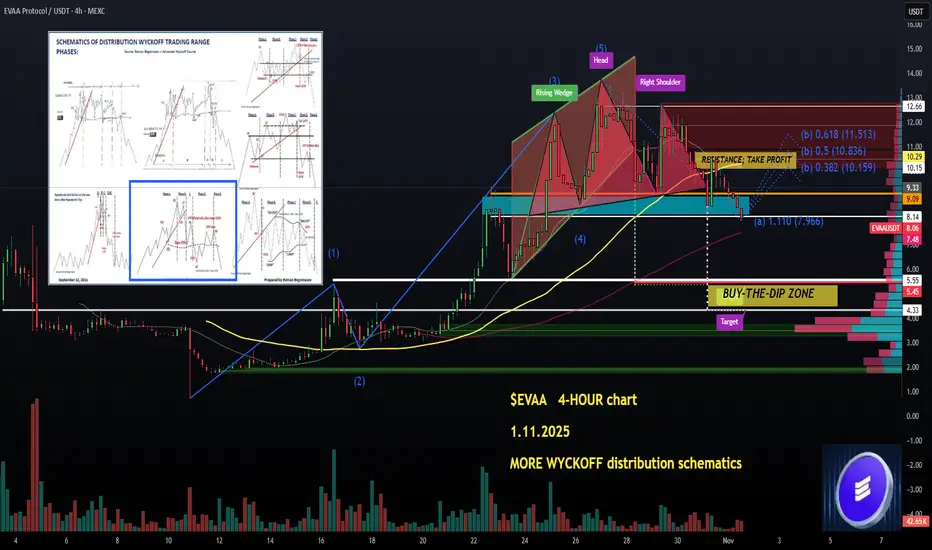
Now, what we have is both an ELLIOT Wave regular retracement and also a variant of the #WYCKOFF distribution pattern (highlighted on the chart).
All this is backed by already clear classical bearish chart patterns that have broken down: a RISING WEDGE (targeting $5.55, a horizontal SUPPORT level — close to my entry) and a HEAD & SHOULDERS (targeting $4.33, also a key horizontal SUPPORT level).
The strategies for me:
1. BUY THOSE DIPS between $4.33 and $5.55. There will be a significant rebound off that zone, 90% guaranteed.
2. A more risky strategy — enter now at $8.20, at SUPPORT, oversold RSI, and hope for a projected DEAD CAT bounce toward $10.2 - $10.9.
The 2 pattern BREAKDOWNS that are active, the WYCKOFF distribution... not looking good short-term. I will exit my remaining 30% of the SPOT slightly above $10 if this happens, and wait for a deeper pullback before a re-entry. Strategy number 1 it is, not advice, never ever.
$CRYPTOCAP:TON has been solid, though, so #EVAA could get another little rally, potentially, we will see. DOWNTREND and stagnating TVL — not BULLISH right now.
👽💙
Now, what we have is both an ELLIOT Wave regular retracement and also a variant of the #WYCKOFF distribution pattern (highlighted on the chart).
All this is backed by already clear classical bearish chart patterns that have broken down: a RISING WEDGE (targeting $5.55, a horizontal SUPPORT level — close to my entry) and a HEAD & SHOULDERS (targeting $4.33, also a key horizontal SUPPORT level).
The strategies for me:
1. BUY THOSE DIPS between $4.33 and $5.55. There will be a significant rebound off that zone, 90% guaranteed.
2. A more risky strategy — enter now at $8.20, at SUPPORT, oversold RSI, and hope for a projected DEAD CAT bounce toward $10.2 - $10.9.
The 2 pattern BREAKDOWNS that are active, the WYCKOFF distribution... not looking good short-term. I will exit my remaining 30% of the SPOT slightly above $10 if this happens, and wait for a deeper pullback before a re-entry. Strategy number 1 it is, not advice, never ever.
$CRYPTOCAP:TON has been solid, though, so #EVAA could get another little rally, potentially, we will see. DOWNTREND and stagnating TVL — not BULLISH right now.
👽💙

Disclaimer
The information and publications are not meant to be, and do not constitute, financial, investment, trading, or other types of advice or recommendations supplied or endorsed by TradingView. Read more in the Terms of Use.
Disclaimer
The information and publications are not meant to be, and do not constitute, financial, investment, trading, or other types of advice or recommendations supplied or endorsed by TradingView. Read more in the Terms of Use.