
The Golden Rest Zone: Where Rallies Pause After the Climb
This post is educational and observational in nature based on historical price action. It is not a forecast or a trading recommendation.
The Fibonacci Retracement Tool
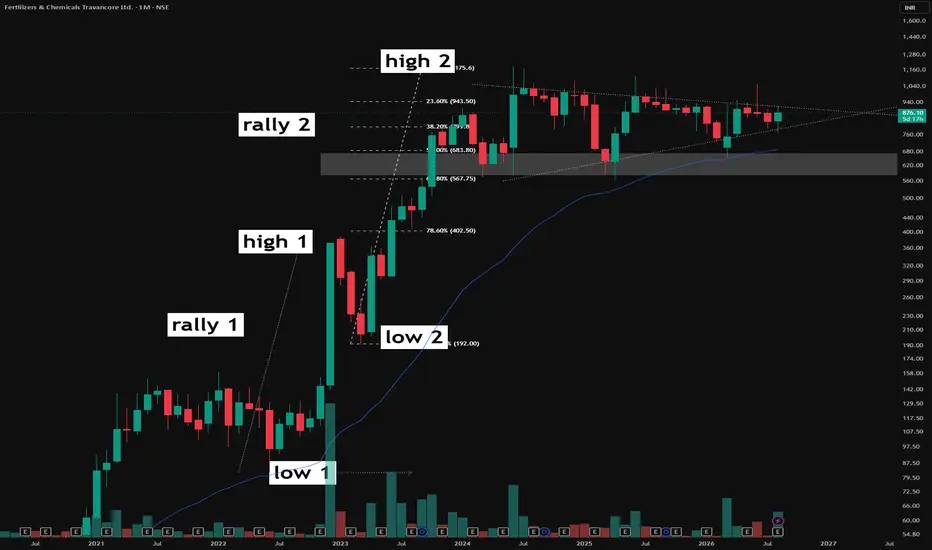
The Fibonacci retracement tool is used here by anchoring it from the lowest point of the swing to the topmost point of that same swing, measuring the full move from bottom to top. This tool maps out key levels within that range, most notably 50% and 61.8%, which together form what is often referred to as the golden zone, one of the more closely watched retracement areas in technical analysis.
The Observation
A recurring behavior on this chart, and one seen across many stocks after a strong rally from a swing low to a swing high, is that price often pauses and consolidates for an extended period specifically within this 50% to 61.8% zone. Rather than retracing shallowly or falling all the way back to the origin of the move, the market frequently settles right within this golden area before deciding its next direction.
The Symmetrical Triangle Pattern
Within this golden zone, a symmetrical triangle pattern has formed. This is a consolidation structure defined by converging lower highs and higher lows, compressing price into a progressively tighter range. Its presence here, sitting precisely within the golden retracement zone, adds another layer of structural context to this pause in the broader move.
The Bigger Picture
This chart highlights how a mathematically derived zone like the Fibonacci golden area can also become the physical location where a price based pattern like a symmetrical triangle forms. Recognizing that consolidation after a strong rally often gravitates toward this specific retracement range is a useful observation for understanding how rest phases in the market tend to take shape.
The Fibonacci Retracement Tool
The Fibonacci retracement tool is used here by anchoring it from the lowest point of the swing to the topmost point of that same swing, measuring the full move from bottom to top. This tool maps out key levels within that range, most notably 50% and 61.8%, which together form what is often referred to as the golden zone, one of the more closely watched retracement areas in technical analysis.
The Observation
A recurring behavior on this chart, and one seen across many stocks after a strong rally from a swing low to a swing high, is that price often pauses and consolidates for an extended period specifically within this 50% to 61.8% zone. Rather than retracing shallowly or falling all the way back to the origin of the move, the market frequently settles right within this golden area before deciding its next direction.
The Symmetrical Triangle Pattern
Within this golden zone, a symmetrical triangle pattern has formed. This is a consolidation structure defined by converging lower highs and higher lows, compressing price into a progressively tighter range. Its presence here, sitting precisely within the golden retracement zone, adds another layer of structural context to this pause in the broader move.
The Bigger Picture
This chart highlights how a mathematically derived zone like the Fibonacci golden area can also become the physical location where a price based pattern like a symmetrical triangle forms. Recognizing that consolidation after a strong rally often gravitates toward this specific retracement range is a useful observation for understanding how rest phases in the market tend to take shape.

📊Swing & positional research with Buy, Sell & Hold recommendations
Contact for NOVEMBER SLOTS
📞WhatsApp ( Pro ): wa.me/919455664601
📢Free Picks on Telegram ( Join ) : t.me/hashtaghammer
Apoorv Dubey|SEBI RA INH000030287
Contact for NOVEMBER SLOTS
📞WhatsApp ( Pro ): wa.me/919455664601
📢Free Picks on Telegram ( Join ) : t.me/hashtaghammer
Apoorv Dubey|SEBI RA INH000030287
Related publications
Disclaimer
The information and publications are not meant to be, and do not constitute, financial, investment, trading, or other types of advice or recommendations supplied or endorsed by TradingView. Read more in the Terms of Use.
📊Swing & positional research with Buy, Sell & Hold recommendations
Contact for NOVEMBER SLOTS
📞WhatsApp ( Pro ): wa.me/919455664601
📢Free Picks on Telegram ( Join ) : t.me/hashtaghammer
Apoorv Dubey|SEBI RA INH000030287
Contact for NOVEMBER SLOTS
📞WhatsApp ( Pro ): wa.me/919455664601
📢Free Picks on Telegram ( Join ) : t.me/hashtaghammer
Apoorv Dubey|SEBI RA INH000030287
Related publications
Disclaimer
The information and publications are not meant to be, and do not constitute, financial, investment, trading, or other types of advice or recommendations supplied or endorsed by TradingView. Read more in the Terms of Use.