
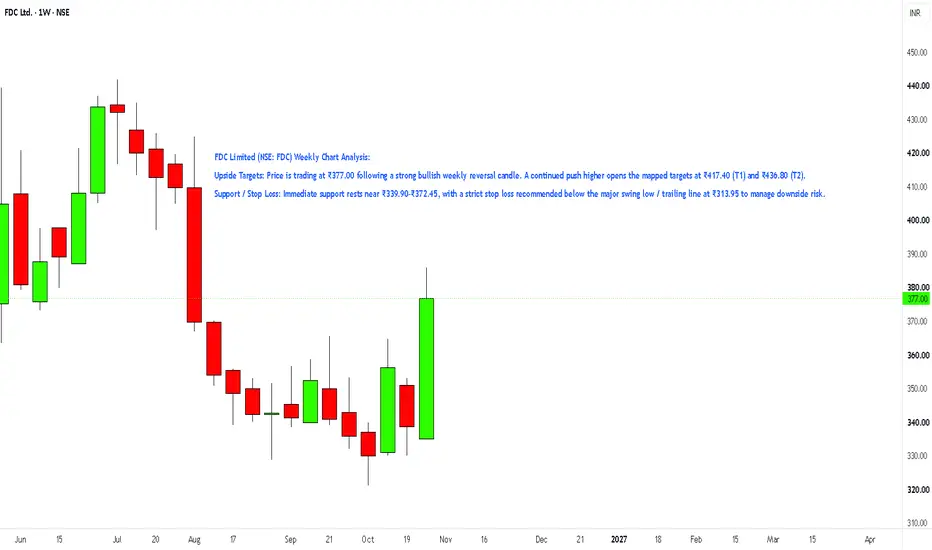
FDC Limited (NSE: FDC) Weekly Chart Analysis:
Upside Targets: Price is trading at ₹377.00 following a strong bullish weekly reversal candle. A continued push higher opens the mapped targets at ₹417.40 (T1) and ₹436.80 (T2).
Support / Stop Loss: Immediate support rests near ₹339.90–₹372.45, with a strict stop loss recommended below the major swing low / trailing line at ₹313.95 to manage downside risk.
Upside Targets: Price is trading at ₹377.00 following a strong bullish weekly reversal candle. A continued push higher opens the mapped targets at ₹417.40 (T1) and ₹436.80 (T2).
Support / Stop Loss: Immediate support rests near ₹339.90–₹372.45, with a strict stop loss recommended below the major swing low / trailing line at ₹313.95 to manage downside risk.

Automated Tools/Indicators/Screeners available at kkonline.org/nimblrta
Disclaimer
The information and publications are not meant to be, and do not constitute, financial, investment, trading, or other types of advice or recommendations supplied or endorsed by TradingView. Read more in the Terms of Use.
Automated Tools/Indicators/Screeners available at kkonline.org/nimblrta
Disclaimer
The information and publications are not meant to be, and do not constitute, financial, investment, trading, or other types of advice or recommendations supplied or endorsed by TradingView. Read more in the Terms of Use.