
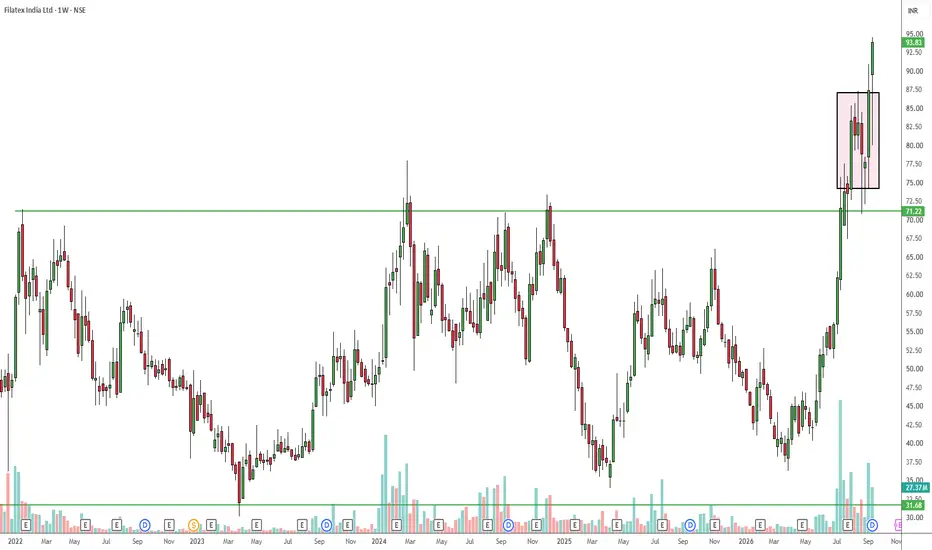
Based on the weekly timeframe, Filatex India Ltd is demonstrating strong bullish momentum following a major structural breakout.
Technical Analysis:
The Breakout: The chart shows a decisive breakout above the long-term horizontal resistance line at 71.22, a level that previously capped upside movement.
The Consolidation: Following the initial surge past 71.22, the price entered a healthy period of consolidation, creating a bullish rectangular flag pattern (highlighted by the pink box).
Current Price Action: The most recent weekly candle has broken out of the top of this pink consolidation box, currently trading around 93.83, indicating a continuation of the primary uptrend.
Trade Plan:
Entry: An entry can be considered at current market levels (~93.83) as it breaks out of the consolidation box, or upon a potential short-term pullback to retest the top boundary of the pink box (around 87.50).
Stop Loss: A structural stop loss is best placed just below the major green support line at 71.22. A weekly close below this level would invalidate the multi-year breakout thesis.
Target: While the chart is in price discovery mode, a standard measured move (projecting the ~40-point height of the previous 31.68 to 71.22 range upward from the breakout) yields a target zone around the 110.00 - 115.00 level.
Technical Analysis:
The Breakout: The chart shows a decisive breakout above the long-term horizontal resistance line at 71.22, a level that previously capped upside movement.
The Consolidation: Following the initial surge past 71.22, the price entered a healthy period of consolidation, creating a bullish rectangular flag pattern (highlighted by the pink box).
Current Price Action: The most recent weekly candle has broken out of the top of this pink consolidation box, currently trading around 93.83, indicating a continuation of the primary uptrend.
Trade Plan:
Entry: An entry can be considered at current market levels (~93.83) as it breaks out of the consolidation box, or upon a potential short-term pullback to retest the top boundary of the pink box (around 87.50).
Stop Loss: A structural stop loss is best placed just below the major green support line at 71.22. A weekly close below this level would invalidate the multi-year breakout thesis.
Target: While the chart is in price discovery mode, a standard measured move (projecting the ~40-point height of the previous 31.68 to 71.22 range upward from the breakout) yields a target zone around the 110.00 - 115.00 level.
Trade closed: target reached
Target achieved.
Disclaimer
The information and publications are not meant to be, and do not constitute, financial, investment, trading, or other types of advice or recommendations supplied or endorsed by TradingView. Read more in the Terms of Use.
Disclaimer
The information and publications are not meant to be, and do not constitute, financial, investment, trading, or other types of advice or recommendations supplied or endorsed by TradingView. Read more in the Terms of Use.