
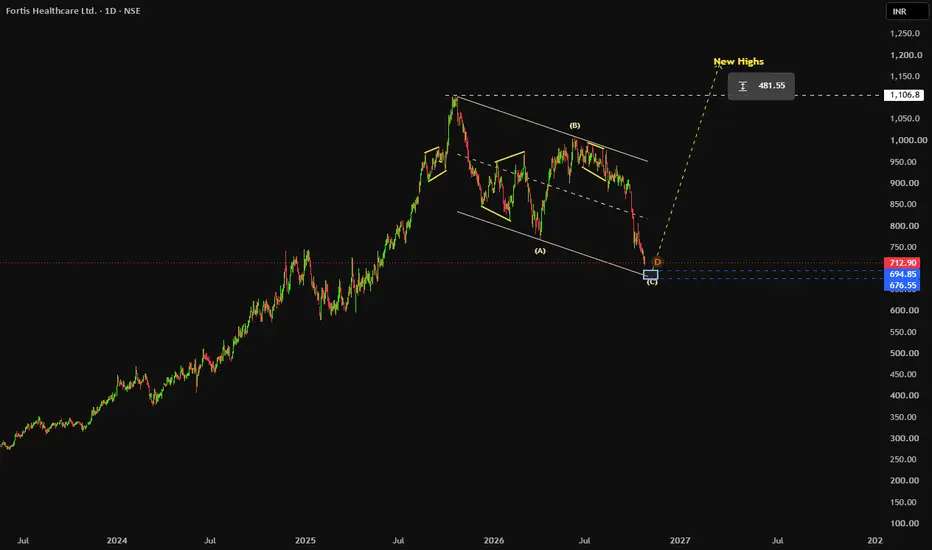
Markets tend to move in high rate of change in the price then pause ,
In Wave theory its refered as Impulse behaviour , when Price move makes significant move
relative to time they enter an price & time correction ,
which are refered as Corrective Patterns as ideally accepted by Traders
Here is one of the Classic Chart pattern that suggest the Correction in The stock is about to end
make reversal on specified measured move level
all of these methods are known as Market patterns or ideal way of looking market
I am looking an New high once the price makes reversal along with Volume in play
If you have any Questions please feel to ask me
Thanks

Disclaimer
The information and publications are not meant to be, and do not constitute, financial, investment, trading, or other types of advice or recommendations supplied or endorsed by TradingView. Read more in the Terms of Use.
Disclaimer
The information and publications are not meant to be, and do not constitute, financial, investment, trading, or other types of advice or recommendations supplied or endorsed by TradingView. Read more in the Terms of Use.