Long
FTM ANALYSIS
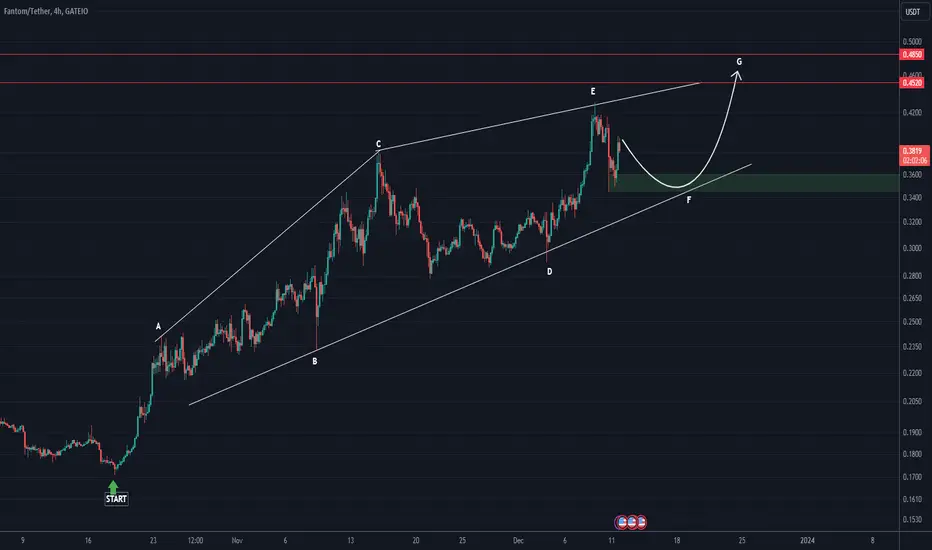
By examining the FTM waves, it appears that the formed pattern is a diametric one. From the green range it can step to complete the G wave. It takes some time to complete the F branch.
What the chart tells us is that the phantom rise will continue. The resistance range is the two red lines that I have marked.
For risk management, please don't forget stop loss and capital management
Comment if you have any questions
Thank You
What the chart tells us is that the phantom rise will continue. The resistance range is the two red lines that I have marked.
For risk management, please don't forget stop loss and capital management
Comment if you have any questions
Thank You
Trade closed: target reached
By hitting the green box, it climbed up to the red lines and gave 24% profit
✅ Join our Telegram channel to succeed in crypto trading.
💎Our CRYPTO Telegram Channel: 👉 t.me/Behdark_EN
💎Our FOREX Telegram Channel: 👉 t.me/FX_Behdark
💎Our CRYPTO Telegram Channel: 👉 t.me/Behdark_EN
💎Our FOREX Telegram Channel: 👉 t.me/FX_Behdark
Disclaimer
The information and publications are not meant to be, and do not constitute, financial, investment, trading, or other types of advice or recommendations supplied or endorsed by TradingView. Read more in the Terms of Use.
✅ Join our Telegram channel to succeed in crypto trading.
💎Our CRYPTO Telegram Channel: 👉 t.me/Behdark_EN
💎Our FOREX Telegram Channel: 👉 t.me/FX_Behdark
💎Our CRYPTO Telegram Channel: 👉 t.me/Behdark_EN
💎Our FOREX Telegram Channel: 👉 t.me/FX_Behdark
Disclaimer
The information and publications are not meant to be, and do not constitute, financial, investment, trading, or other types of advice or recommendations supplied or endorsed by TradingView. Read more in the Terms of Use.