
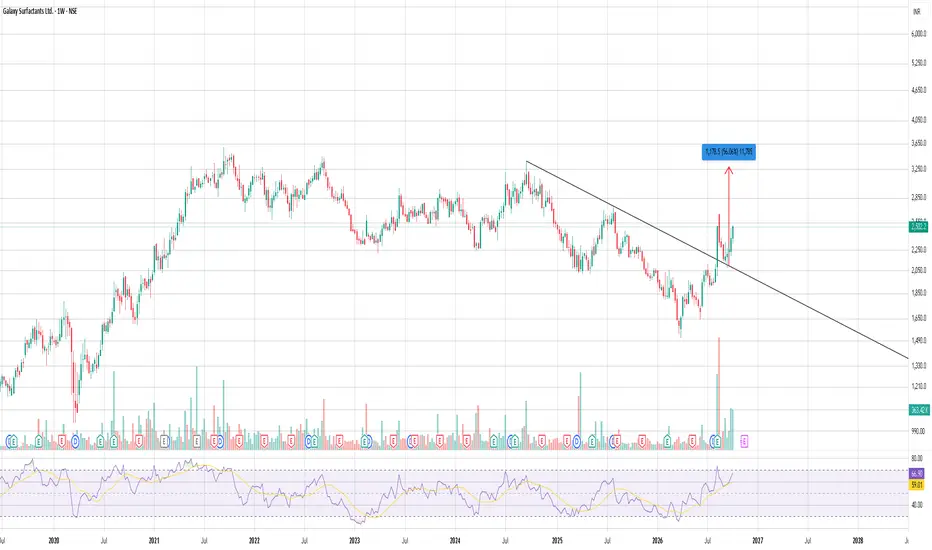
Galaxy Surfactants has formed a Double Bottom, followed by a breakout above the neckline and a successful retest. Price has also broken above the long-term descending trendline, indicating a possible change in trend from bearish to bullish.
The stock is currently trading around ₹2,502, with strong buying activity visible during the recent upward move. RSI is near 67, showing positive momentum, although some short-term consolidation is possible.
If the stock sustains above the breakout zone around ₹2,250–₹2,350, the bullish structure remains intact. The next resistance is around ₹2,600–₹2,850. A sustained move above this zone could open the way toward ₹3,250–₹3,300.
The target marked on the chart is approximately ₹3,280. A fall back below the breakout zone would weaken the setup.
DISCLAIMER:
For educational and informational purposes only. This is my personal technical analysis, not financial or trading advice or a recommendation to buy/sell. Do your own research before trading. Markets involve substantial risk, and all levels, targets and setups are illustrative and not guaranteed. Trade with proper risk management and never rely solely on this analysis.
Trade with logic. Risk with discipline.
Logic Trade Room
The stock is currently trading around ₹2,502, with strong buying activity visible during the recent upward move. RSI is near 67, showing positive momentum, although some short-term consolidation is possible.
If the stock sustains above the breakout zone around ₹2,250–₹2,350, the bullish structure remains intact. The next resistance is around ₹2,600–₹2,850. A sustained move above this zone could open the way toward ₹3,250–₹3,300.
The target marked on the chart is approximately ₹3,280. A fall back below the breakout zone would weaken the setup.
DISCLAIMER:
For educational and informational purposes only. This is my personal technical analysis, not financial or trading advice or a recommendation to buy/sell. Do your own research before trading. Markets involve substantial risk, and all levels, targets and setups are illustrative and not guaranteed. Trade with proper risk management and never rely solely on this analysis.
Trade with logic. Risk with discipline.
Logic Trade Room

Disclaimer
The information and publications are not meant to be, and do not constitute, financial, investment, trading, or other types of advice or recommendations supplied or endorsed by TradingView. Read more in the Terms of Use.
Disclaimer
The information and publications are not meant to be, and do not constitute, financial, investment, trading, or other types of advice or recommendations supplied or endorsed by TradingView. Read more in the Terms of Use.