
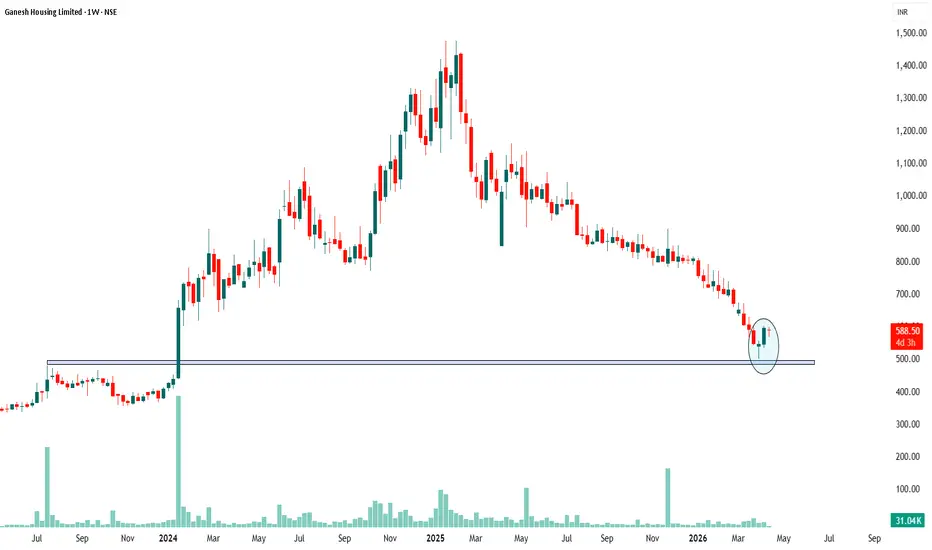
Ganesh Housing had a massive rally from ₹500 all the way to nearly ₹1,400 in 2024 — almost a 3x move. But after that peak, the stock spent all of 2025 giving back those gains, grinding lower week after week until it landed right back where it all started — the ₹500 zone.
That level isn't random. It's where huge buying had happened back in early 2024, which is what launched the big rally in the first place. When price revisits such a zone, those same buyers tend to show up again to defend it — and that's exactly what happened here. Price briefly spiked below ₹500, got rejected hard, and snapped back to close at ₹589. That long lower wick tells you sellers tried to push it down and simply couldn't hold it there.
One small correction on the pattern — what's circled is close to a Morning Star but not quite textbook. A proper Morning Star needs three candles with a small indecision candle in the middle. What's visible here is better described as a bullish rejection or hammer at support. Same bullish message, just be precise with the label.
The big picture though is clear — a historically strong support level held, and buyers responded with conviction. From here, watch whether the price can sustain above ₹500 on weekly closing basis. If it builds higher lows from here, a move back toward ₹700 becomes realistic. A weekly close below ₹500 however would be a red flag and the setup would be off the table.
Promising chart, but confirmation over the next couple of weeks is what really matters.
This is purely for educational purposes and not financial advice. Always consult a SEBI-registered advisor before making any investment decisions.*
That level isn't random. It's where huge buying had happened back in early 2024, which is what launched the big rally in the first place. When price revisits such a zone, those same buyers tend to show up again to defend it — and that's exactly what happened here. Price briefly spiked below ₹500, got rejected hard, and snapped back to close at ₹589. That long lower wick tells you sellers tried to push it down and simply couldn't hold it there.
One small correction on the pattern — what's circled is close to a Morning Star but not quite textbook. A proper Morning Star needs three candles with a small indecision candle in the middle. What's visible here is better described as a bullish rejection or hammer at support. Same bullish message, just be precise with the label.
The big picture though is clear — a historically strong support level held, and buyers responded with conviction. From here, watch whether the price can sustain above ₹500 on weekly closing basis. If it builds higher lows from here, a move back toward ₹700 becomes realistic. A weekly close below ₹500 however would be a red flag and the setup would be off the table.
Promising chart, but confirmation over the next couple of weeks is what really matters.
This is purely for educational purposes and not financial advice. Always consult a SEBI-registered advisor before making any investment decisions.*

Disclaimer
The information and publications are not meant to be, and do not constitute, financial, investment, trading, or other types of advice or recommendations supplied or endorsed by TradingView. Read more in the Terms of Use.
Disclaimer
The information and publications are not meant to be, and do not constitute, financial, investment, trading, or other types of advice or recommendations supplied or endorsed by TradingView. Read more in the Terms of Use.