

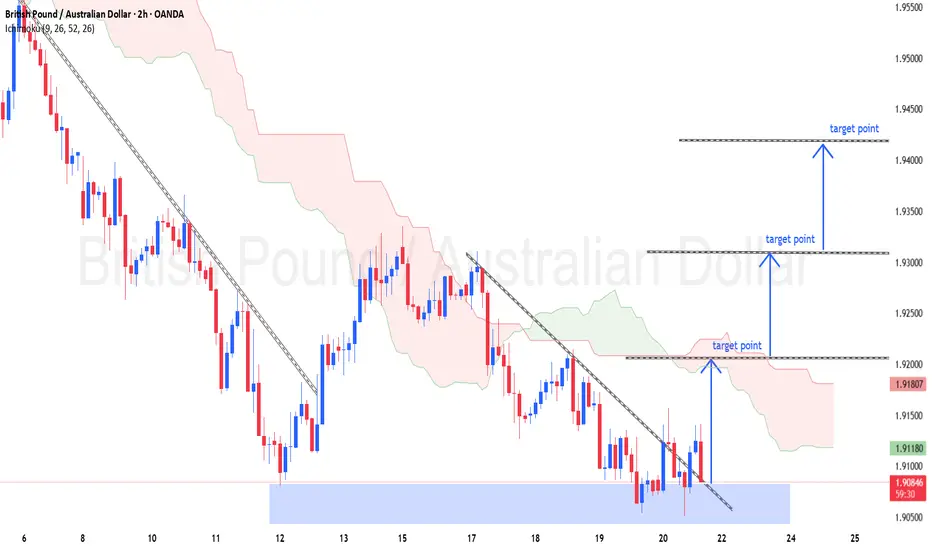
GBPAUD – 2H CHART.
(based on MY chart) 📈
Market has reacted from strong demand zone and broken the descending trendline, so upside continuation is expected.
🎯 Target 1 (TP1): 1.9200
🎯 Target 2 (TP2): 1.9300
🎯 Target 3 (TP3): 1.9400
Bias: Bullish
Reason:
Break & close above downtrend line
Bounce from demand zone
Ichimoku cloud resistance aligned with targets.
Trade active
active trades 
📲 Join telegram channel free .
t.me/addlist/7jtN1zcz9W05MDVk
Forex, Gold & Crypto Signals with detailed analysis & get consistent results.
Gold Signal's with proper TP & SL for high profit opportunities.
t.me/addlist/7jtN1zcz9W05MDVk
Forex, Gold & Crypto Signals with detailed analysis & get consistent results.
Gold Signal's with proper TP & SL for high profit opportunities.
Related publications
Disclaimer
The information and publications are not meant to be, and do not constitute, financial, investment, trading, or other types of advice or recommendations supplied or endorsed by TradingView. Read more in the Terms of Use.