

Fundamental Analysis
GBPUSD remains under pressure as price continues to trade below the main EMA structure. For next week, traders should keep watching USD momentum, U.K. data, and broader risk sentiment.
For now, the technical structure still favours sellers while recovery attempts remain capped below EMA resistance.
Technical Analysis
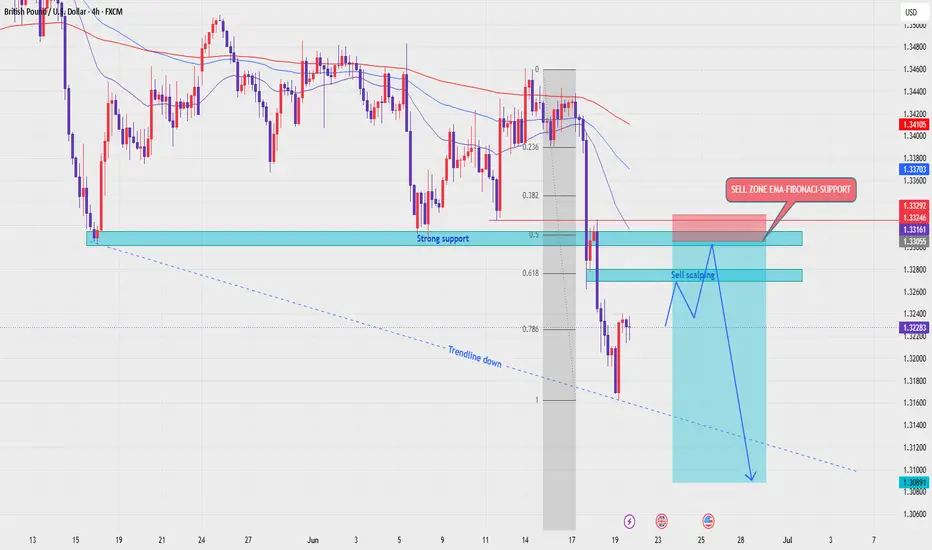
On the 4H chart, GBPUSD is still moving inside a bearish structure, with EMA 34, EMA 89, and EMA 200 positioned above price. This confirms that the broader trend remains bearish.
Price recently broke below the strong support zone around 1.3305 - 1.3324 and continued lower toward 1.3170 - 1.3180. The current move looks like a short-term recovery after a strong bearish displacement, not a confirmed bullish reversal.
The key sell zone is around 1.3305 - 1.3324. This area is important because it combines the previous strong support, Fibonacci 0.5 retracement, EMA resistance, and the support-turned-resistance structure.
The second reaction area is around 1.3275 - 1.3285, near the Fibonacci 0.618 zone. This may offer a short-term sell scalping reaction if price fails to reclaim higher structure.
The main downside target for next week is around 1.3090 - 1.3089, which aligns with the lower bearish projection and liquidity target on the chart.
Important Key Levels
Current price area: 1.3228
Sell scalping zone: 1.3275 - 1.3285
Main sell zone: 1.3305 - 1.3324
EMA resistance area: 1.3305 - 1.3370
Strong support turned resistance: 1.3305 - 1.3324
Short-term downside level: 1.3180
Main weekly target: 1.3090 - 1.3089
Invalidation area: above 1.3370
Trading Scenario
Main Sell Scenario
Entry: 1.3305 - 1.3324
Stop Loss: 1.3370
Take Profit 1: 1.3180
Take Profit 2: 1.3140
Take Profit 3: 1.3090 - 1.3089
Sell Condition
The preferred setup is to wait for GBPUSD to pull back into the 1.3305 - 1.3324 sell zone. This area aligns with Fibonacci retracement, EMA resistance, and the previous support zone that has now turned into resistance.
A sell setup becomes more valid if price forms bearish rejection from this zone, such as a long upper wick, bearish engulfing candle, failed breakout, or lower high below the EMA structure.
If price rejects from the sell zone and breaks back below 1.3180, the bearish continuation view becomes stronger. The next downside focus would be 1.3140, followed by the weekly target around 1.3090 - 1.3089.
Alternative Sell Scalping Zone
Entry: 1.3275 - 1.3285
Stop Loss: 1.3325
Take Profit 1: 1.3228
Take Profit 2: 1.3180
Take Profit 3: 1.3140
Sell Condition
This is the earlier sell reaction zone. It is only valid if price reaches 1.3275 - 1.3285 and shows clear bearish rejection below the main EMA resistance.
If price breaks strongly above this zone, the better setup is to wait for the main sell zone around 1.3305 - 1.3324.
Entry Conditions
Wait for price to retest the Fibonacci sell zone.
Look for bearish rejection before entering sell.
A break below 1.3180 confirms stronger downside pressure.
If price breaks and holds above 1.3370, the sell setup is invalid.
Overall, the main view for next week remains bearish while GBPUSD stays below EMA 34, EMA 89, EMA 200, and the broken support structure. The preferred plan is to wait for a pullback into the Fibonacci and EMA value zone around 1.3305 - 1.3324, then look for sell confirmation toward 1.3180 and 1.3090 - 1.3089.
Do you share the same bearish view on GBPUSD for next week, or are you waiting for a cleaner rejection from the EMA and Fibonacci value zone?

📊 XAU Macro Pulse · XAUUSD · GBPUSD · EURUSD
Every setup earns its place on the chart.
🔔 Follow the structure. The rest is noise.
Personal analysis only t.me/+ZahF8It14l40OWNl
Every setup earns its place on the chart.
🔔 Follow the structure. The rest is noise.
Personal analysis only t.me/+ZahF8It14l40OWNl
Related publications
Disclaimer
The information and publications are not meant to be, and do not constitute, financial, investment, trading, or other types of advice or recommendations supplied or endorsed by TradingView. Read more in the Terms of Use.
📊 XAU Macro Pulse · XAUUSD · GBPUSD · EURUSD
Every setup earns its place on the chart.
🔔 Follow the structure. The rest is noise.
Personal analysis only t.me/+ZahF8It14l40OWNl
Every setup earns its place on the chart.
🔔 Follow the structure. The rest is noise.
Personal analysis only t.me/+ZahF8It14l40OWNl
Related publications
Disclaimer
The information and publications are not meant to be, and do not constitute, financial, investment, trading, or other types of advice or recommendations supplied or endorsed by TradingView. Read more in the Terms of Use.