
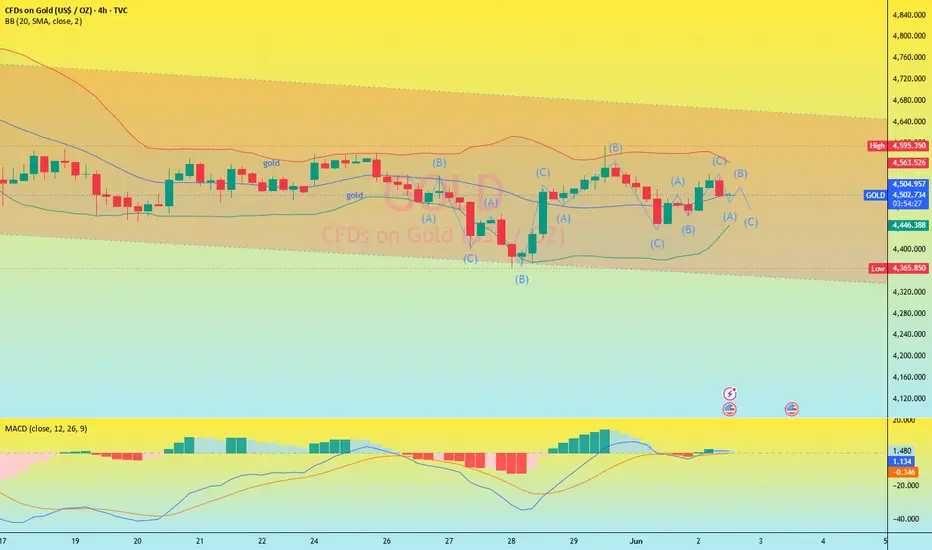
On the daily chart for spot gold, a clear downward trend is maintained. The current price has broken below the $4600 horizontal resistance zone and has been trading below the 100-day simple moving average (approximately $4801) for an extended period, solidifying the bearish pattern. The 200-day moving average at $4411 is currently providing support. Technically, the RSI is around 43 and the ADX is around 24, indicating exhausted bullish momentum and continued downward pressure.
Signal Analysis and Suggestions:
Selling Resistance Levels: Short-term selling pressure is at $4557-$4578, with a key level at $4610. A break and hold above $4610 would likely continue the upward trend.
Buying Support Levels: Short-term support is at $4482-$4465, with a key level at $4430. A break below the key support level of $4430 would initiate a deeper downtrend, significantly strengthening the bearish signal.
Signal Analysis and Suggestions:
Selling Resistance Levels: Short-term selling pressure is at $4557-$4578, with a key level at $4610. A break and hold above $4610 would likely continue the upward trend.
Buying Support Levels: Short-term support is at $4482-$4465, with a key level at $4430. A break below the key support level of $4430 would initiate a deeper downtrend, significantly strengthening the bearish signal.
Note
Accurate signals are the only way to accumulate wealth.Note
For real-time, detailed signals, please check out our free signal group or leave a message.Note
Good luck to all traders.Note
Traders who are unable to effectively seize trading opportunities or whose accounts are difficult to manage can leave me a message in the free group at any time, and I will provide free analysis and guidance.
Disclaimer
The information and publications are not meant to be, and do not constitute, financial, investment, trading, or other types of advice or recommendations supplied or endorsed by TradingView. Read more in the Terms of Use.
Disclaimer
The information and publications are not meant to be, and do not constitute, financial, investment, trading, or other types of advice or recommendations supplied or endorsed by TradingView. Read more in the Terms of Use.