 XAUUSD GOLD
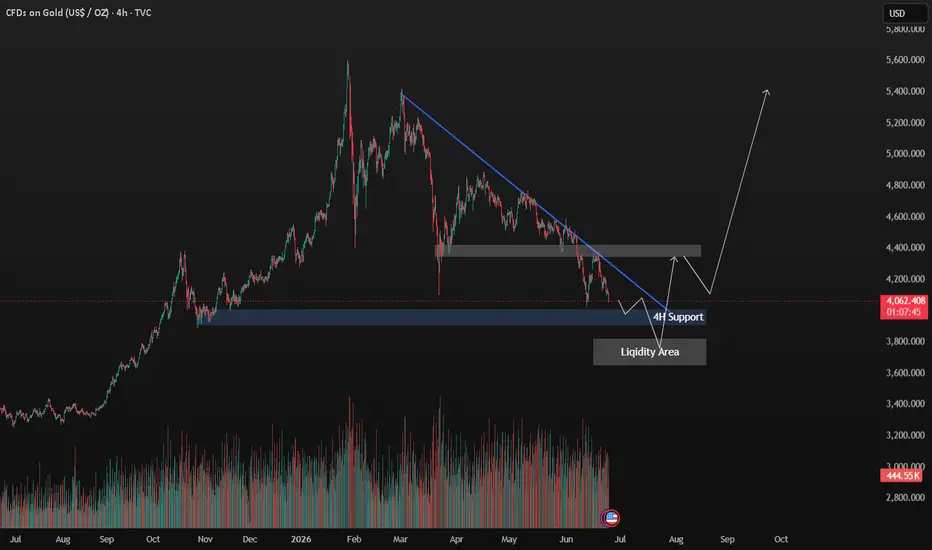
 Gold is currently trading at $4,065.328 on the 4-hour timeframe, continuing a significant medium-term correction. After reaching peak highs near the $5,400–$5,600 zone earlier in the year, the asset has established a clear sequence of lower highs and lower lows. The current price action is heavily dictated by a dominant descending trendline that has capped bullish momentum for several months.
Key Technical Observations
Descending Resistance: A steep, unbroken blue trendline highlights the prevailing bearish momentum. Every attempt to rally has been systematically rejected at this dynamic resistance level.
4H Support & Liquidity Zone: There is a critical support block established around the $3,900–$4,000 region, which has recently served as the last line of defense for buyers. Just below this support lies a defined "Liquidity Area." In institutional trading concepts, areas below major swing lows often harbor large clusters of stop-loss orders.
Overhead Resistance: Above the current price action, a structural resistance block rests near the $4,300–$4,400 level. This area must be reclaimed by buyers to shift the macro market structure back to bullish.
Anticipated Price Scenario: The "Liquidity Sweep" Reversal
The path projected by the white arrows on the chart outlines a classic "liquidity sweep" or "spring" setup, which is a common precursor to major trend reversals.
The Flush (Liquidity Grab): The chart anticipates a final, sharp drop below the "4H Support" to sweep the "Liquidity Area." This move is designed to trigger stop-losses and trap breakout traders going short.
The Rejection & Reversal: Following the sweep, a rapid buying response is expected, pushing the price violently back above the $4,000 support level. This V-shaped recovery would indicate that smart money has accumulated positions at a discount.
Trendline & Structure Break: The impulsive move upward is projected to break both the descending blue trendline and pierce through the immediate overhead resistance block near $4,300.
Macro Continuation: After a minor pullback or consolidation at the newly broken resistance (turning it into support), the long-term projection points toward a massive bullish continuation, targeting previous structural highs near $5,400.
Conclusion
The XAU/USD 4H chart indicates that while bears are currently in control, the market is approaching an exhaustion point. Traders should watch closely for a drop into the liquidity zone below $4,000 followed by an immediate, high-volume rejection. A successful liquidity sweep followed by a breakout of the descending trendline would invalidate the bearish structure and signal a strong buying opportunity for the next major leg up.

welcome to 'Trades With Malik' for VVIP group and signal contact me at my telegram @tradeswithmalik7
Happy trading
Happy trading
Disclaimer
The information and publications are not meant to be, and do not constitute, financial, investment, trading, or other types of advice or recommendations supplied or endorsed by TradingView. Read more in the Terms of Use.
welcome to 'Trades With Malik' for VVIP group and signal contact me at my telegram @tradeswithmalik7
Happy trading
Happy trading
Disclaimer
The information and publications are not meant to be, and do not constitute, financial, investment, trading, or other types of advice or recommendations supplied or endorsed by TradingView. Read more in the Terms of Use.