
Gold 🥇 | Comprehensive Technical Analysis - Setting a Significant Rejection Zone
Current Price: Around $4,353 | Timeframe: Daily - Weekly
Date: October 21, 2025
══════
📊 Overview On the Market:
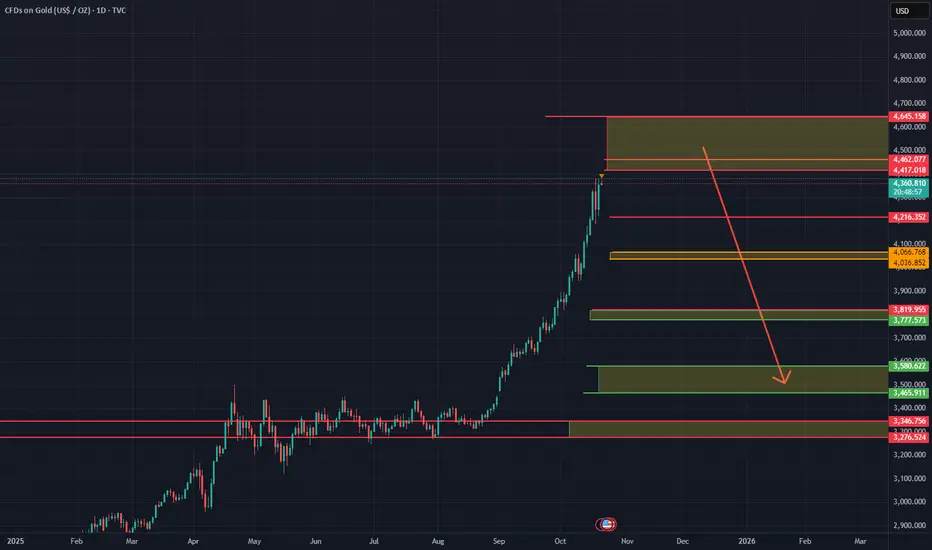
Gold has completed an exceptional bullish cycle, reaching new all-time highs above 4,400, which I believe represents the local high for the current phase.
However, several technical factors now point to an imminent correction before any potential continuation.
══════
🔍 Key Technical Notes:
▪️ Price Zone:
The stock is currently trading in a bullish zone—an area where institutional investors historically tend to take profits and open short positions.
▪️ Market Sentiment:
Fear and Greed Index: 78/100 (Extreme Greed)
These extreme readings in bullish zones precede corrections in 85% of historical cases.
▪️ Structural Analysis:
- Overall Structure: Bullish (higher timeframes)
- Internal Structure: Showing signs of weakness and bearish divergence
- A potential Change in Personality (CHoCH) is forming on medium timeframes
▪️ Supply and Demand Zones:
Multiple untested resistance zones below, as well as unfilled fair value gaps that act as price magnets.
▪️ Multiple Timeframe Analysis:
Price is analyzed across multiple timeframes (4-hour, 1-day, 1-week, etc.) using advanced order flow techniques and proprietary market structure mapping tools—all of which point to a potential upcoming correction.
══════
🎯 Expected Scenario (High Probability):
Stage 1 - Initial Correction:
📍 Target 1: $3,777-$3,816
(Balance Zone)
📍 Target 2: $3,688-$3,749
(Discount Zone - Optimal Entry)
Stage 2 - Deeper Correction (Moderate Probability):
📍 Target 3: $3,465-$3,580
(Strong Institutional Demand - Buy Orders)
In addition to unfilled fair value gaps that act as price magnets.
Note: Additional Confirmation Required
After Reaching the Discount Zones:
The possibility of a continued uptrend exists, but is not currently highly likely. The situation will be reassessed upon reaching the demand zones.
══════
⚡ Why this analysis?
This analysis is based on:
✓ Advanced order flow analysis techniques
✓ Professional tools for mapping market structure
✓ Premium/Discount Zone Theory
✓ Detecting institutional order blocks
✓ Market sentiment analysis
✓ Liquidity level mapping
These are not traditional retail trading tools; they are institutional analysis techniques used by professional traders.
═════
📚 Previous Record:
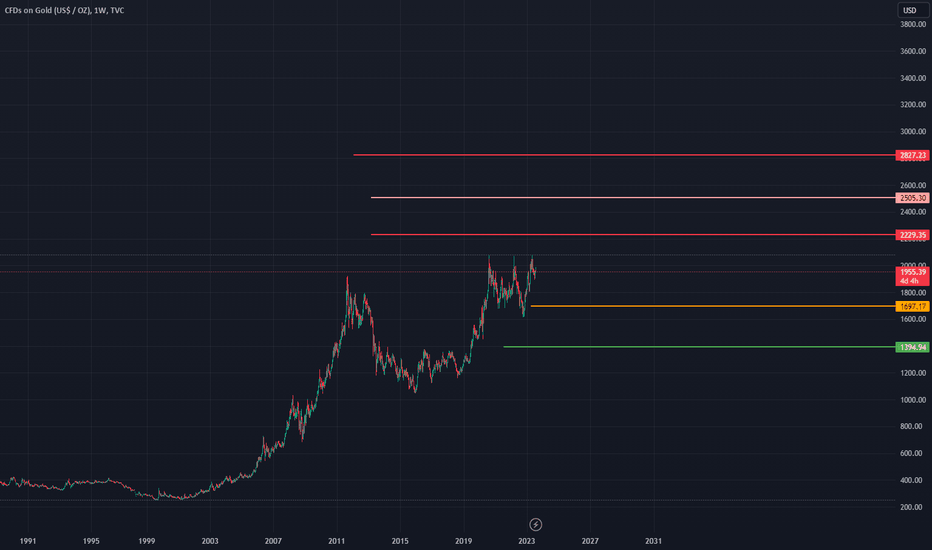
Some may remember my previous analysis of gold in August 2023:
📌 Analysis for August 13 2023:
- Expectations: Rise from 1780
- Targets: 2500 → 2800 → Over 3800
- Result: ✅ 100% Success Rate
- Actual Movement: Reaching over 4400 (147% Profit)
- Update (April 2024): "Trade Closed at Target"
This analysis is based on the same institutional framework applied to this current situation. The methodology is effective because it tracks actual cash flow—not trader sentiment.
═════ ═════
⚠️ Risk Management (Mandatory):
Regardless of your confidence level, risk management is non-negotiable:
✓ Don't risk more than 1-2% of your capital on each trade.
✓ Always set a stop-loss before entering.
✓ Avoid excessive leverage.
✓ Maximize your profits. Steps
✓ Research yourself (DYOR)
══════════════════════════════════════ ═════
⚖️ Disclaimer:
This is educational technical analysis and does not constitute financial advice or an investment recommendation.
Trading carries a significant risk of capital loss.
Past performance does not guarantee future results.
Trade at your own risk.
Consult a licensed financial advisor before making any investment decisions.
══════
💬 Share your opinion with us:
What do you think of gold at these levels?
📊 If you found this analysis helpful, don't forget to like and follow it for more analysis.
🔔 Turn on notifications to receive updates as soon as this setting develops.
═════
Current Price: Around $4,353 | Timeframe: Daily - Weekly
Date: October 21, 2025
══════
📊 Overview On the Market:
Gold has completed an exceptional bullish cycle, reaching new all-time highs above 4,400, which I believe represents the local high for the current phase.
However, several technical factors now point to an imminent correction before any potential continuation.
══════
🔍 Key Technical Notes:
▪️ Price Zone:
The stock is currently trading in a bullish zone—an area where institutional investors historically tend to take profits and open short positions.
▪️ Market Sentiment:
Fear and Greed Index: 78/100 (Extreme Greed)
These extreme readings in bullish zones precede corrections in 85% of historical cases.
▪️ Structural Analysis:
- Overall Structure: Bullish (higher timeframes)
- Internal Structure: Showing signs of weakness and bearish divergence
- A potential Change in Personality (CHoCH) is forming on medium timeframes
▪️ Supply and Demand Zones:
Multiple untested resistance zones below, as well as unfilled fair value gaps that act as price magnets.
▪️ Multiple Timeframe Analysis:
Price is analyzed across multiple timeframes (4-hour, 1-day, 1-week, etc.) using advanced order flow techniques and proprietary market structure mapping tools—all of which point to a potential upcoming correction.
══════
🎯 Expected Scenario (High Probability):
Stage 1 - Initial Correction:
📍 Target 1: $3,777-$3,816
(Balance Zone)
📍 Target 2: $3,688-$3,749
(Discount Zone - Optimal Entry)
Stage 2 - Deeper Correction (Moderate Probability):
📍 Target 3: $3,465-$3,580
(Strong Institutional Demand - Buy Orders)
In addition to unfilled fair value gaps that act as price magnets.
Note: Additional Confirmation Required
After Reaching the Discount Zones:
The possibility of a continued uptrend exists, but is not currently highly likely. The situation will be reassessed upon reaching the demand zones.
══════
⚡ Why this analysis?
This analysis is based on:
✓ Advanced order flow analysis techniques
✓ Professional tools for mapping market structure
✓ Premium/Discount Zone Theory
✓ Detecting institutional order blocks
✓ Market sentiment analysis
✓ Liquidity level mapping
These are not traditional retail trading tools; they are institutional analysis techniques used by professional traders.
═════
📚 Previous Record:
Some may remember my previous analysis of gold in August 2023:
📌 Analysis for August 13 2023:
- Expectations: Rise from 1780
- Targets: 2500 → 2800 → Over 3800
- Result: ✅ 100% Success Rate
- Actual Movement: Reaching over 4400 (147% Profit)
- Update (April 2024): "Trade Closed at Target"
This analysis is based on the same institutional framework applied to this current situation. The methodology is effective because it tracks actual cash flow—not trader sentiment.
═════ ═════
⚠️ Risk Management (Mandatory):
Regardless of your confidence level, risk management is non-negotiable:
✓ Don't risk more than 1-2% of your capital on each trade.
✓ Always set a stop-loss before entering.
✓ Avoid excessive leverage.
✓ Maximize your profits. Steps
✓ Research yourself (DYOR)
══════════════════════════════════════ ═════
⚖️ Disclaimer:
This is educational technical analysis and does not constitute financial advice or an investment recommendation.
Trading carries a significant risk of capital loss.
Past performance does not guarantee future results.
Trade at your own risk.
Consult a licensed financial advisor before making any investment decisions.
══════
💬 Share your opinion with us:
What do you think of gold at these levels?
📊 If you found this analysis helpful, don't forget to like and follow it for more analysis.
🔔 Turn on notifications to receive updates as soon as this setting develops.
═════
Note
Note
(XAUUSD Outlook — Current Price: 4,573)Nearest Target (Next Peak):
4,600
Next Upside Zones (Potential checkpoints before the main target):
4,612–4,635
4,700–4,720
Main Upside Target:
The highest potential peak for the current market is 4,822, with a 57% probability.
Expected Correction & Support Levels:
A near support zone that may help maintain the bullish move and support reaching the targets above: 4,442–4,462
A temporary wick / brief dip may extend to: 4,339
Note: This scenario is expected after reaching the peak, as a deep correction.
Major strong support at: 3,819, with an 85% probability.
Additional levels are shown on the chart.

Related publications
Disclaimer
The information and publications are not meant to be, and do not constitute, financial, investment, trading, or other types of advice or recommendations supplied or endorsed by TradingView. Read more in the Terms of Use.
Disclaimer
The information and publications are not meant to be, and do not constitute, financial, investment, trading, or other types of advice or recommendations supplied or endorsed by TradingView. Read more in the Terms of Use.