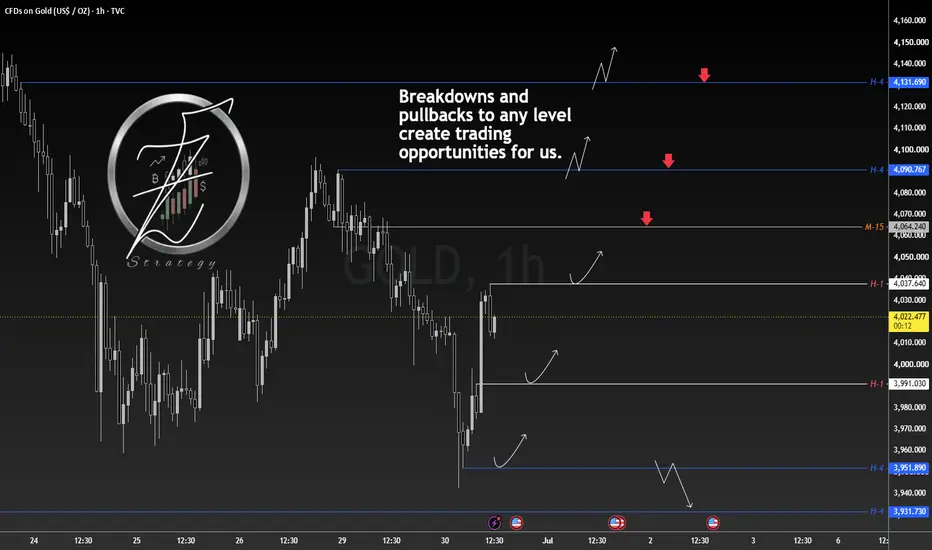
XAUUSD position | H1 Chart (Entry on M15)
Follow price XAUUSD
❇️ Analysis Description: I'm analyzing the 1H timeframe where the blue lines represent major H-4 levels. Every level (H-4, H-1, M-15) is a potential trade opportunity if we get a clean breakout and pullback.
🔼 Buy-sell Setup:
Trending Markets: I look for a 'Pullback Candle' (first candle to break the previous swing's high/low with 80%+ body). Target: Previous untested zones or fixed R:R 2.5.
Ranging Markets: I ignore the overall trend and play the range extremes using the same 'Pullback Candle' logic. Target: R:R 1.5 - 2.0.
🕯 Entry Plan (5-Minute Confirmation):
Follow price
XAUUSD❇️ Analysis Description: I'm analyzing the 1H timeframe where the blue lines represent major H-4 levels. Every level (H-4, H-1, M-15) is a potential trade opportunity if we get a clean breakout and pullback.
🔼 Buy-sell Setup:
Trending Markets: I look for a 'Pullback Candle' (first candle to break the previous swing's high/low with 80%+ body). Target: Previous untested zones or fixed R:R 2.5.
Ranging Markets: I ignore the overall trend and play the range extremes using the same 'Pullback Candle' logic. Target: R:R 1.5 - 2.0.
🕯 Entry Plan (5-Minute Confirmation):
[] Wait for the breakout of the static/dynamic level and the 'Pullback Candle'.
[] Entry: Wait for the retest of the breakout line. Confirm with a price action trigger on the M5 chart.- Stop Loss: Behind the last swing (preferred/safer) or behind the breakout candle.
- [] ⚠️ The 15m timeframe is riskier, but offers better R:R ratios. Stick to your risk management!
[] 💬 What are your thoughts on these levels? Let me know in the comments!
Trade active
Trade closed: target reached
R/R: 2 by setupNote
Reaction to my levels ........
Related publications
Disclaimer
The information and publications are not meant to be, and do not constitute, financial, investment, trading, or other types of advice or recommendations supplied or endorsed by TradingView. Read more in the Terms of Use.
Related publications
Disclaimer
The information and publications are not meant to be, and do not constitute, financial, investment, trading, or other types of advice or recommendations supplied or endorsed by TradingView. Read more in the Terms of Use.