
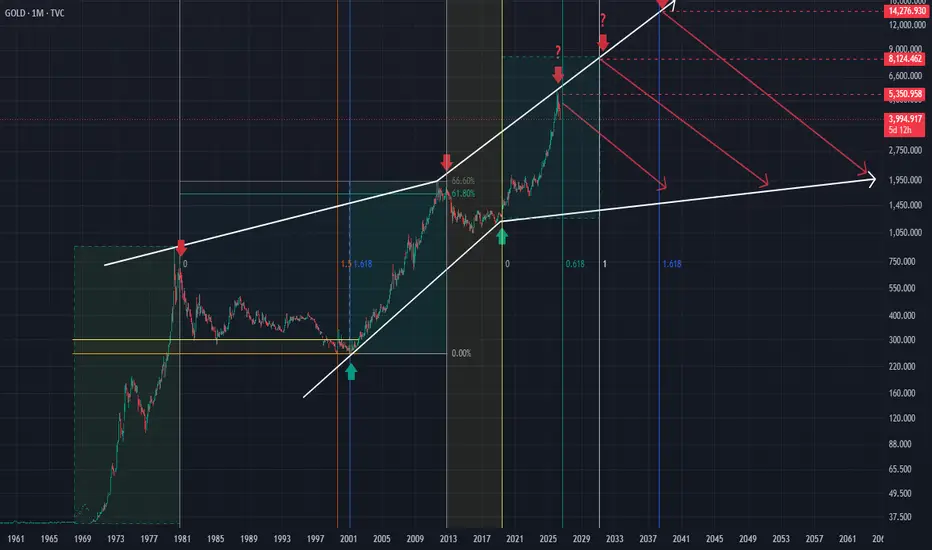
The Evolution of a Long-Term Cycle
When most traders look at Gold, their focus is on the current movement and price levels.
However, in higher timeframes, the most important information is not always found in price itself.
Sometimes, the most critical insights lie in the rhythm of cycles, their time development, and how the market transitions from one phase to another.
By examining the long-term history of Gold, we can identify several major structural phases, each playing a different role within the broader market cycle.
The first major cycle was a strong expansion phase that began in 1968 from the $37 region and continued until the 1980 peak around $890.
This move created a major expansion structure within Gold’s long-term behavior.
After that, the market entered the next phase; however, this time not in the form of a simple price expansion, but as a corrective and time-based cycle.
This corrective phase lasted approximately 1.5 times longer than the previous expansion cycle in terms of duration, showing that in large markets, correction does not always happen through price — sometimes time is the dominant factor.
After the completion of that phase, the next bullish cycle began.
This move started in 2001 from around $250 and continued until the 2011 peak near $1,900.
A notable observation is that this bullish cycle had a duration approximately similar to the first expansion cycle.
This time symmetry highlights the importance of studying cycle rhythm in higher timeframes.
---
The Current Cycle
The current cycle began in 2019 from the $1,250 region.
It is still in development and has not yet reached completion.
On the chart, both the potential time path and the corresponding price zones for this phase have been identified.
However, the important point is that these areas are not simply price targets.
They represent zones where multiple key factors may converge:
Cycle timing
Price action
Market structure
Trader behavior
Movement complexity
Alignment with higher-degree cycles
The main objective is not to define a precise top.
The objective is to identify the stage at which this long-term cycle reaches maturity.
---
Time Is The Key Factor
In the early stages of a major trend, price is usually the dominant factor.
However, as a cycle matures, time becomes increasingly important.
Large markets often show signs of imbalance between time, price, and structure before a phase transition occurs.
For this reason, a major cycle top cannot be identified solely through trendlines or price levels.
Instead, it requires evaluating whether multiple structural components are converging at a specific point in time.
---
Possible Completion Phase
At the current stage, Gold is still developing and has not confirmed a final top.
Several potential time windows for cycle completion have been identified on the chart.
Each of these zones may represent a phase where the current cycle enters its final maturation stage.
The market will ultimately determine which scenario becomes reality.
However, one principle remains consistent across all major cycles:
The larger and longer the expansion phase, the more significant the subsequent rebalancing phase tends to be.
---
Final Correction Phase (Important Extension)
If this cycle reaches completion, the market could enter a very large and structural corrective phase.
This phase is a natural part of long-term cycle rebalancing and can be significant both in terms of price and time.
📉 Potential Price Range:
In this scenario, the correction could extend toward:
$1,800 – $1,500
This range is not a simple price target, but rather a structural rebalancing zone within the broader cycle.
---
⏳ Time Dimension of the Correction:
If this phase begins from the current level and aligns with the 0.618 time window marked on the chart, it could develop into a very long and extended process.
The minimum duration of this phase would be:
4,717 days ≈ approximately 12 years and 11 months (almost 13 years)
This implies that in major cycles, correction is not just a fast price move — it can evolve into a long, structural, and multi-year process that plays a key role in resetting the entire cycle.
---
Final Perspective
This analysis is not about predicting an exact top in Gold.
Because major market tops are not isolated price points — they are the result of a completed process.
The main focus is to understand Gold’s current position within a multi-decade cycle.
The current cycle is still incomplete.
The move may continue.
However, as the market approaches the completion phase, the importance of time and cycle alignment becomes increasingly significant.
If this process completes within one of the identified time windows, the probability of a major long-term corrective and rebalancing phase increases substantially.
Because ultimately:
Every major cycle reaches a point where its expansion energy is exhausted, and the market requires a new equilibrium.
✍🏻 Mohsen Nirumand
⚠️ Risk Management is the foundation of survival and long-term profitability in trading
📌 Always use a proper stop loss
📌 Never risk more than a small % per trade
📌 Avoid over-leveraging your account
📌 Stick to your trading plan, not emotions
📌 Let the market come to you, don’t chase trades
📌 Consistency matters more than quick profits
If you found this analysis valuable, your support means a lot 👇
boost 🚀 | share 🔄 | comment 💬 | follow ✅️
If you ever need a detailed analysis on any market, any timeframe, or a multi-timeframe analysis where different timeframes align and complement each other as a complete market roadmap, feel free to reach out.
I can provide key levels, accurate and realistic market scenarios, and high-probability trading setups tailored to your chart and trading objectives.
Feel free to message me anytime.
When most traders look at Gold, their focus is on the current movement and price levels.
However, in higher timeframes, the most important information is not always found in price itself.
Sometimes, the most critical insights lie in the rhythm of cycles, their time development, and how the market transitions from one phase to another.
By examining the long-term history of Gold, we can identify several major structural phases, each playing a different role within the broader market cycle.
The first major cycle was a strong expansion phase that began in 1968 from the $37 region and continued until the 1980 peak around $890.
This move created a major expansion structure within Gold’s long-term behavior.
After that, the market entered the next phase; however, this time not in the form of a simple price expansion, but as a corrective and time-based cycle.
This corrective phase lasted approximately 1.5 times longer than the previous expansion cycle in terms of duration, showing that in large markets, correction does not always happen through price — sometimes time is the dominant factor.
After the completion of that phase, the next bullish cycle began.
This move started in 2001 from around $250 and continued until the 2011 peak near $1,900.
A notable observation is that this bullish cycle had a duration approximately similar to the first expansion cycle.
This time symmetry highlights the importance of studying cycle rhythm in higher timeframes.
---
The Current Cycle
The current cycle began in 2019 from the $1,250 region.
It is still in development and has not yet reached completion.
On the chart, both the potential time path and the corresponding price zones for this phase have been identified.
However, the important point is that these areas are not simply price targets.
They represent zones where multiple key factors may converge:
Cycle timing
Price action
Market structure
Trader behavior
Movement complexity
Alignment with higher-degree cycles
The main objective is not to define a precise top.
The objective is to identify the stage at which this long-term cycle reaches maturity.
---
Time Is The Key Factor
In the early stages of a major trend, price is usually the dominant factor.
However, as a cycle matures, time becomes increasingly important.
Large markets often show signs of imbalance between time, price, and structure before a phase transition occurs.
For this reason, a major cycle top cannot be identified solely through trendlines or price levels.
Instead, it requires evaluating whether multiple structural components are converging at a specific point in time.
---
Possible Completion Phase
At the current stage, Gold is still developing and has not confirmed a final top.
Several potential time windows for cycle completion have been identified on the chart.
Each of these zones may represent a phase where the current cycle enters its final maturation stage.
The market will ultimately determine which scenario becomes reality.
However, one principle remains consistent across all major cycles:
The larger and longer the expansion phase, the more significant the subsequent rebalancing phase tends to be.
---
Final Correction Phase (Important Extension)
If this cycle reaches completion, the market could enter a very large and structural corrective phase.
This phase is a natural part of long-term cycle rebalancing and can be significant both in terms of price and time.
📉 Potential Price Range:
In this scenario, the correction could extend toward:
$1,800 – $1,500
This range is not a simple price target, but rather a structural rebalancing zone within the broader cycle.
---
⏳ Time Dimension of the Correction:
If this phase begins from the current level and aligns with the 0.618 time window marked on the chart, it could develop into a very long and extended process.
The minimum duration of this phase would be:
4,717 days ≈ approximately 12 years and 11 months (almost 13 years)
This implies that in major cycles, correction is not just a fast price move — it can evolve into a long, structural, and multi-year process that plays a key role in resetting the entire cycle.
---
Final Perspective
This analysis is not about predicting an exact top in Gold.
Because major market tops are not isolated price points — they are the result of a completed process.
The main focus is to understand Gold’s current position within a multi-decade cycle.
The current cycle is still incomplete.
The move may continue.
However, as the market approaches the completion phase, the importance of time and cycle alignment becomes increasingly significant.
If this process completes within one of the identified time windows, the probability of a major long-term corrective and rebalancing phase increases substantially.
Because ultimately:
Every major cycle reaches a point where its expansion energy is exhausted, and the market requires a new equilibrium.
✍🏻 Mohsen Nirumand
⚠️ Risk Management is the foundation of survival and long-term profitability in trading
📌 Always use a proper stop loss
📌 Never risk more than a small % per trade
📌 Avoid over-leveraging your account
📌 Stick to your trading plan, not emotions
📌 Let the market come to you, don’t chase trades
📌 Consistency matters more than quick profits
If you found this analysis valuable, your support means a lot 👇
boost 🚀 | share 🔄 | comment 💬 | follow ✅️
If you ever need a detailed analysis on any market, any timeframe, or a multi-timeframe analysis where different timeframes align and complement each other as a complete market roadmap, feel free to reach out.
I can provide key levels, accurate and realistic market scenarios, and high-probability trading setups tailored to your chart and trading objectives.
Feel free to message me anytime.
Trade active
────────────────────────────────────────Gold: Update on the Diametric Seven-Phase Structural Cycle
────────────────────────────────────────
Figure 1: Updated Gold structural framework showing the Diametric Seven-Phase Cycle, the ongoing Phase V expansion, and the associated time–price maturity thresholds and structural checkpoints.
────────────────────────────────────────
The long-term Gold structure is now interpreted as a Diametric Seven-Phase Structural Cycle, with its internal phases defined in the updated framework as:
Vector Alpha (Phase I) → Vector Beta (Phase II) → Vector Gamma (Phase III) → Vector Delta (Phase IV) → Vector Epsilon (Phase V) → Vector Zeta (Phase VI) → Vector Omega (Final Phase VII).
The market remains within Vector Epsilon (Phase V), the ongoing expansion following the completion of Vector Delta (Phase IV) in 2019. The current structural model does not yet confirm the completion of Phase V.
Time–Price Structure
Because Vector Epsilon (Phase V) is the structural counterpart of Vector Gamma (Phase III), its maturity is assessed against Gamma’s duration and proportional relationships.
Three principal temporal thresholds remain relevant:
0.618 — 2027/06
First valid structural maturity threshold.
1.000 — 2032/06
Full temporal equality with Vector Gamma and the highest-weight scenario within the current model.
1.618 — 2040/07
Maximum permissible temporal extension for the current expansion.
These thresholds are not independent forecasts or fixed dates for a market top. They represent structural maturity points, whose significance depends on the convergence of time, price, and structural position.
The updated price-extension framework identifies four principal structural checkpoints:
$4,250 → $5,900 → $8,970 → $18,943
These levels are not rigid price targets. Gold may extend beyond any of them before reaching temporal maturity.
After Phase V
Once Vector Epsilon (Phase V) reaches structural completion, the model anticipates a transition into Vector Zeta (Phase VI). Its primary role would be macro structural rebalancing, rather than simply initiating a bearish trend.
A complete corrective phase would require a retracement of at least 50% of the Phase V expansion. The current projection therefore identifies the $1,500–$1,800 region as a potential rebalancing zone and structural foundation for Vector Omega (Final Phase VII).
Completion Confirmation
Neither a price target nor a temporal threshold alone confirms the completion of Vector Epsilon.
Final confirmation requires the Post-Completion Structural Action Rule: the first bearish movement must fully retrace the final bullish sub-wave of Phase V in less time than that sub-wave required to develop. This would confirm a shift in temporal and structural dominance from buyers to sellers.
Structural Invalidation
The model remains subject to explicit invalidation criteria.
A monthly close below $1,800 before 2027/06 would invalidate the current Phase V interpretation and could require the movements identified as Phases III–V to be reclassified as internal subdivisions of a larger Phase III.
A monthly close below $1,250 before the 0.618 temporal threshold would invalidate not only the current scenario but the entire Diametric Seven-Phase Structural Cycle hypothesis.
Until either condition is met, the current expansion remains structurally active.
The core principle remains unchanged: the completion of a major structural cycle requires convergence of time, price, and structure.
Mohsen Neyromand

Disclaimer
The information and publications are not meant to be, and do not constitute, financial, investment, trading, or other types of advice or recommendations supplied or endorsed by TradingView. Read more in the Terms of Use.
Disclaimer
The information and publications are not meant to be, and do not constitute, financial, investment, trading, or other types of advice or recommendations supplied or endorsed by TradingView. Read more in the Terms of Use.