
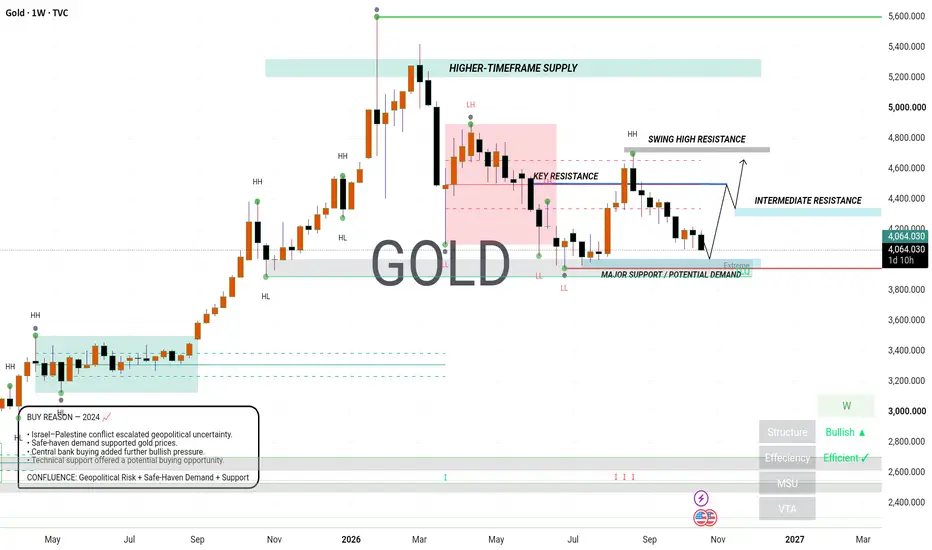
Gold (XAUUSD) Weekly Analysis | 2024–2026
Market Overview
This analysis examines Gold’s weekly price action from 2024 onward, focusing on market structure, institutional buying and selling pressure, liquidity, key support and resistance levels, and major fundamental drivers.
1. Early 2024 — Bullish Momentum
Gold experienced strong bullish momentum during 2024. Rising expectations of monetary easing, central-bank purchases, geopolitical uncertainty, and safe-haven demand contributed to the broader bullish environment.
Candle interpretation: Strong bullish weekly candles indicated buying pressure. Large candle bodies suggested momentum, while upper wicks showed areas where sellers attempted to push prices lower.
2. Geopolitical Uncertainty — Safe-Haven Demand
The Israel–Palestine conflict and wider regional tensions contributed to uncertainty in financial markets. During periods of heightened geopolitical risk, investors may increase exposure to traditional safe-haven assets such as Gold.
Candle interpretation: Bullish candles during periods of rising geopolitical risk may reflect increased demand. However, each candle must be compared with its actual date and market news before assigning a specific cause.
3. Breakouts Above Previous Highs
When Gold moved above previous swing highs, it showed that buyers were able to overcome an earlier resistance area.
Candle interpretation: A strong weekly close above resistance can indicate a potential breakout. A candle with a long upper wick or a close back below resistance may instead indicate rejection or a false breakout.
4. Pullbacks and Profit-Taking
After a strong upward move, Gold may experience temporary declines as traders take profits, the US dollar strengthens, bond yields rise, or interest-rate expectations change.
Candle interpretation: Bearish candles do not automatically reverse the overall trend. If price maintains higher lows and holds major support, the pullback may remain corrective.
5. Higher Highs and Higher Lows
A sequence of higher highs (HH) and higher lows (HL) generally indicates bullish market structure.
Candle interpretation: Higher highs suggest buyers are pushing price beyond previous peaks. Higher lows indicate that buyers are entering before price returns to the previous low. A break below an important higher low may weaken this structure.
6. Resistance and Supply Zones
The marked resistance and supply zones identify areas where price previously faced selling pressure.
Candle interpretation: Rejection candles, long upper wicks, or bearish engulfing patterns near these zones may suggest selling interest. A confirmed weekly close above a zone may weaken its resistance significance.
7. Support and Demand Zones
The marked support and demand zones identify areas where buyers may previously have entered the market.
Candle interpretation: Long lower wicks and bullish closes near support may indicate buying interest. Support is not guaranteed to hold, and a decisive weekly close below it may signal further downside risk.
8. Fundamental Factors to Monitor
Gold prices can respond to several interconnected factors:
- US Federal Reserve interest-rate decisions and expectations.
- US dollar strength or weakness.
- Treasury yields and inflation expectations.
- Central-bank Gold purchases.
- Geopolitical risks and safe-haven demand.
- Economic data and changes in investor positioning.
These factors can support or weaken Gold, but no single factor explains every weekly candle.
9. Current Market Structure and Scenarios
Bullish scenario: Price holds a major support zone, forms a higher low, and closes above resistance with follow-through.
Bearish scenario: Price rejects a resistance zone, forms a lower high, and closes below an important support level.
Neutral scenario: Price remains between support and resistance without a confirmed breakout.
Conclusion
Gold’s weekly structure should be evaluated through candle closes, swing highs and lows, liquidity, and reactions at key levels. Fundamental news provides context, while price action helps assess whether buying or selling pressure is being confirmed.
This analysis presents possible market scenarios rather than guaranteed outcomes. Always confirm the setup and manage risk before entering a trade.
BTC BUY REASON — 2024

• Strong institutional demand following U.S. Spot Bitcoin ETF approvals.
• ETF inflows supported buying pressure.
• Anticipation of the April 2024 Bitcoin Halving strengthened the bullish narrative.
• Key price support provided a potential buying opportunity.
CONFLUENCE: ETF Demand + Halving Narrative + Technical Support
Educational analysis only — not financial advice.
Market Overview
This analysis examines Gold’s weekly price action from 2024 onward, focusing on market structure, institutional buying and selling pressure, liquidity, key support and resistance levels, and major fundamental drivers.
1. Early 2024 — Bullish Momentum
Gold experienced strong bullish momentum during 2024. Rising expectations of monetary easing, central-bank purchases, geopolitical uncertainty, and safe-haven demand contributed to the broader bullish environment.
Candle interpretation: Strong bullish weekly candles indicated buying pressure. Large candle bodies suggested momentum, while upper wicks showed areas where sellers attempted to push prices lower.
2. Geopolitical Uncertainty — Safe-Haven Demand
The Israel–Palestine conflict and wider regional tensions contributed to uncertainty in financial markets. During periods of heightened geopolitical risk, investors may increase exposure to traditional safe-haven assets such as Gold.
Candle interpretation: Bullish candles during periods of rising geopolitical risk may reflect increased demand. However, each candle must be compared with its actual date and market news before assigning a specific cause.
3. Breakouts Above Previous Highs
When Gold moved above previous swing highs, it showed that buyers were able to overcome an earlier resistance area.
Candle interpretation: A strong weekly close above resistance can indicate a potential breakout. A candle with a long upper wick or a close back below resistance may instead indicate rejection or a false breakout.
4. Pullbacks and Profit-Taking
After a strong upward move, Gold may experience temporary declines as traders take profits, the US dollar strengthens, bond yields rise, or interest-rate expectations change.
Candle interpretation: Bearish candles do not automatically reverse the overall trend. If price maintains higher lows and holds major support, the pullback may remain corrective.
5. Higher Highs and Higher Lows
A sequence of higher highs (HH) and higher lows (HL) generally indicates bullish market structure.
Candle interpretation: Higher highs suggest buyers are pushing price beyond previous peaks. Higher lows indicate that buyers are entering before price returns to the previous low. A break below an important higher low may weaken this structure.
6. Resistance and Supply Zones
The marked resistance and supply zones identify areas where price previously faced selling pressure.
Candle interpretation: Rejection candles, long upper wicks, or bearish engulfing patterns near these zones may suggest selling interest. A confirmed weekly close above a zone may weaken its resistance significance.
7. Support and Demand Zones
The marked support and demand zones identify areas where buyers may previously have entered the market.
Candle interpretation: Long lower wicks and bullish closes near support may indicate buying interest. Support is not guaranteed to hold, and a decisive weekly close below it may signal further downside risk.
8. Fundamental Factors to Monitor
Gold prices can respond to several interconnected factors:
- US Federal Reserve interest-rate decisions and expectations.
- US dollar strength or weakness.
- Treasury yields and inflation expectations.
- Central-bank Gold purchases.
- Geopolitical risks and safe-haven demand.
- Economic data and changes in investor positioning.
These factors can support or weaken Gold, but no single factor explains every weekly candle.
9. Current Market Structure and Scenarios
Bullish scenario: Price holds a major support zone, forms a higher low, and closes above resistance with follow-through.
Bearish scenario: Price rejects a resistance zone, forms a lower high, and closes below an important support level.
Neutral scenario: Price remains between support and resistance without a confirmed breakout.
Conclusion
Gold’s weekly structure should be evaluated through candle closes, swing highs and lows, liquidity, and reactions at key levels. Fundamental news provides context, while price action helps assess whether buying or selling pressure is being confirmed.
This analysis presents possible market scenarios rather than guaranteed outcomes. Always confirm the setup and manage risk before entering a trade.
BTC BUY REASON — 2024
• Strong institutional demand following U.S. Spot Bitcoin ETF approvals.
• ETF inflows supported buying pressure.
• Anticipation of the April 2024 Bitcoin Halving strengthened the bullish narrative.
• Key price support provided a potential buying opportunity.
CONFLUENCE: ETF Demand + Halving Narrative + Technical Support
Educational analysis only — not financial advice.

Disclaimer
The information and publications are not meant to be, and do not constitute, financial, investment, trading, or other types of advice or recommendations supplied or endorsed by TradingView. Read more in the Terms of Use.
Disclaimer
The information and publications are not meant to be, and do not constitute, financial, investment, trading, or other types of advice or recommendations supplied or endorsed by TradingView. Read more in the Terms of Use.