
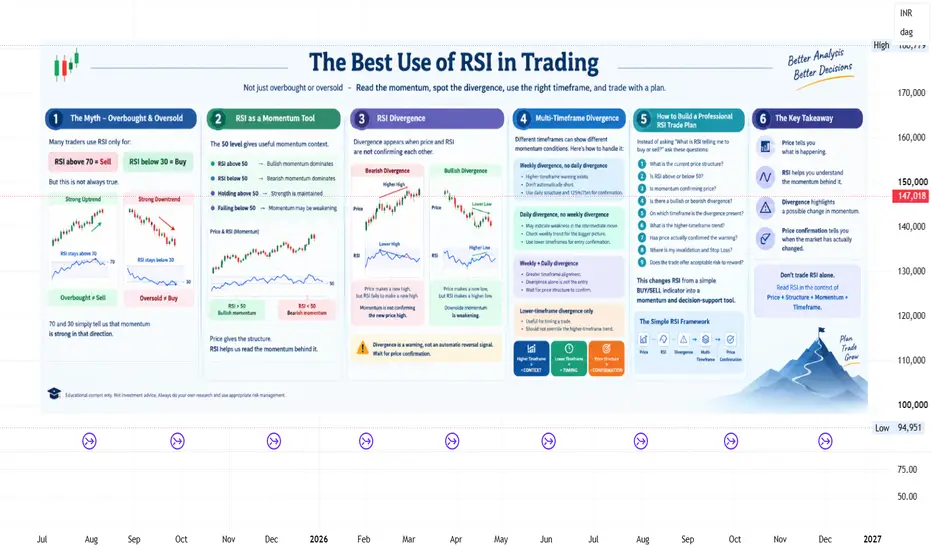
THE BEST USE OF RSI IN TRADING
RSI is one of the most widely used indicators in technical analysis.
But many traders use it only for:
RSI above 70 = Sell
RSI below 30 = Buy
That is where the real understanding of RSI often stops.
Let's understand how RSI can be used more effectively.
1. THE BIGGEST RSI MYTH — OVERBOUGHT & OVERSOLD
RSI above 70 does NOT automatically mean price must fall.
RSI below 30 does NOT automatically mean price must rise.
In a strong uptrend, RSI can remain above 70 while price continues to move higher.
In a strong downtrend, RSI can remain below 30 while price continues lower.
So don't treat 70 and 30 as automatic entry signals.
Overbought ≠ Sell
Oversold ≠ Buy
They simply tell us that momentum is strong in that direction.
2. RSI IS A MOMENTUM TOOL
One of the most useful RSI levels is actually 50.
Don't focus only on where RSI is today.
Observe how RSI behaves as price develops its structure.
Price gives the structure.
RSI helps us read the momentum behind that structure.
3. NOW COMES THE POWER OF RSI — DIVERGENCE
Divergence appears when price and RSI are not confirming each other.
BEARISH DIVERGENCE
Price → Higher High
RSI → Lower High
Price is making a new high, but RSI is unable to make a new high.
This indicates that momentum is not confirming the new price high.
BULLISH DIVERGENCE
Price → Lower Low
RSI → Higher Low
Price is making a new low, but RSI is making a higher low.
This indicates that downside momentum is weakening.
But remember:
Divergence is a warning, not an automatic reversal signal.
Price still needs to confirm the change.
4. HOW TO HANDLE MULTI-TIMEFRAME RSI DIVERGENCE
This is where RSI becomes much more useful.
Different timeframes can show different momentum conditions at the same time.
For example:
WEEKLY RSI DIVERGENCE, BUT NO DAILY DIVERGENCE
The weekly chart is showing a higher-timeframe momentum warning.
But the daily trend may still be healthy.
DAILY RSI DIVERGENCE, BUT NO WEEKLY DIVERGENCE
This may indicate weakness in the intermediate move without necessarily signalling a major weekly reversal.
WEEKLY + DAILY DIVERGENCE
When divergence appears across multiple higher timeframes, the momentum warning has greater timeframe alignment.
But even here:
Divergence alone is not the entry.
Wait for price structure to confirm.
LOWER-TIMEFRAME DIVERGENCE ONLY
A divergence on 125m or 75m may be useful for timing a trade, but it should not automatically override the higher-timeframe trend.
Think of it simply:
Higher Timeframe = CONTEXT
Lower Timeframe = TIMING
Price Structure = CONFIRMATION
5. HOW TO BUILD A PROFESSIONAL RSI TRADE PLAN
Instead of asking:
"What is RSI telling me to buy or sell?"
Ask these questions:
This changes RSI from a simple BUY/SELL indicator into a momentum and decision-support tool.
THE SIMPLE RSI FRAMEWORK
PRICE → What is happening?
RSI → What is happening to momentum?
DIVERGENCE → Is momentum confirming price?
MULTI-TIMEFRAME → Where does this matter?
PRICE CONFIRMATION → Is there a trade?
THE KEY TAKEAWAY
Price tells you what is happening.
RSI helps you understand the momentum behind it.
Divergence highlights a possible change in momentum.
Price confirmation tells you when the market has actually changed.
Don't trade RSI alone.
Read RSI in the context of Price + Structure + Momentum + Timeframe.
Disclaimer: This post is for educational purposes only and should not be considered investment advice or a recommendation to buy or sell any security. Always conduct your own research and use appropriate risk management.
RSI is one of the most widely used indicators in technical analysis.
But many traders use it only for:
RSI above 70 = Sell
RSI below 30 = Buy
That is where the real understanding of RSI often stops.
Let's understand how RSI can be used more effectively.
1. THE BIGGEST RSI MYTH — OVERBOUGHT & OVERSOLD
RSI above 70 does NOT automatically mean price must fall.
RSI below 30 does NOT automatically mean price must rise.
In a strong uptrend, RSI can remain above 70 while price continues to move higher.
In a strong downtrend, RSI can remain below 30 while price continues lower.
So don't treat 70 and 30 as automatic entry signals.
Overbought ≠ Sell
Oversold ≠ Buy
They simply tell us that momentum is strong in that direction.
2. RSI IS A MOMENTUM TOOL
One of the most useful RSI levels is actually 50.
- RSI above 50 → bullish momentum is generally dominant
- RSI below 50 → bearish momentum is generally dominant
- RSI repeatedly holding above 50 → strength is being maintained
- RSI repeatedly failing below/around 50 → momentum may be weakening
Don't focus only on where RSI is today.
Observe how RSI behaves as price develops its structure.
Price gives the structure.
RSI helps us read the momentum behind that structure.
3. NOW COMES THE POWER OF RSI — DIVERGENCE
Divergence appears when price and RSI are not confirming each other.
BEARISH DIVERGENCE
Price → Higher High
RSI → Lower High
Price is making a new high, but RSI is unable to make a new high.
This indicates that momentum is not confirming the new price high.
BULLISH DIVERGENCE
Price → Lower Low
RSI → Higher Low
Price is making a new low, but RSI is making a higher low.
This indicates that downside momentum is weakening.
But remember:
Divergence is a warning, not an automatic reversal signal.
Price still needs to confirm the change.
4. HOW TO HANDLE MULTI-TIMEFRAME RSI DIVERGENCE
This is where RSI becomes much more useful.
Different timeframes can show different momentum conditions at the same time.
For example:
WEEKLY RSI DIVERGENCE, BUT NO DAILY DIVERGENCE
The weekly chart is showing a higher-timeframe momentum warning.
But the daily trend may still be healthy.
- Don't automatically short because of weekly divergence.
- Monitor the daily price structure.
- Use lower timeframes such as 125m/75m for confirmation and timing.
DAILY RSI DIVERGENCE, BUT NO WEEKLY DIVERGENCE
This may indicate weakness in the intermediate move without necessarily signalling a major weekly reversal.
- Check whether the daily trend is actually breaking.
- Watch the weekly structure for the bigger picture.
- Use lower timeframes for entry confirmation if a trade setup develops.
WEEKLY + DAILY DIVERGENCE
When divergence appears across multiple higher timeframes, the momentum warning has greater timeframe alignment.
But even here:
Divergence alone is not the entry.
Wait for price structure to confirm.
LOWER-TIMEFRAME DIVERGENCE ONLY
A divergence on 125m or 75m may be useful for timing a trade, but it should not automatically override the higher-timeframe trend.
Think of it simply:
Higher Timeframe = CONTEXT
Lower Timeframe = TIMING
Price Structure = CONFIRMATION
5. HOW TO BUILD A PROFESSIONAL RSI TRADE PLAN
Instead of asking:
"What is RSI telling me to buy or sell?"
Ask these questions:
- What is the current price structure?
- Is RSI above or below 50?
- Is momentum confirming price?
- Is there a bullish or bearish divergence?
- On which timeframe is the divergence present?
- What is the higher-timeframe trend?
- Has price actually confirmed the momentum warning?
- Where is my invalidation and Stop Loss?
- Does the trade offer acceptable risk-to-reward?
This changes RSI from a simple BUY/SELL indicator into a momentum and decision-support tool.
THE SIMPLE RSI FRAMEWORK
PRICE → What is happening?
RSI → What is happening to momentum?
DIVERGENCE → Is momentum confirming price?
MULTI-TIMEFRAME → Where does this matter?
PRICE CONFIRMATION → Is there a trade?
THE KEY TAKEAWAY
Price tells you what is happening.
RSI helps you understand the momentum behind it.
Divergence highlights a possible change in momentum.
Price confirmation tells you when the market has actually changed.
Don't trade RSI alone.
Read RSI in the context of Price + Structure + Momentum + Timeframe.
Disclaimer: This post is for educational purposes only and should not be considered investment advice or a recommendation to buy or sell any security. Always conduct your own research and use appropriate risk management.

Disclaimer
The information and publications are not meant to be, and do not constitute, financial, investment, trading, or other types of advice or recommendations supplied or endorsed by TradingView. Read more in the Terms of Use.
Disclaimer
The information and publications are not meant to be, and do not constitute, financial, investment, trading, or other types of advice or recommendations supplied or endorsed by TradingView. Read more in the Terms of Use.