
🥇 GOLD BEES: GOLDEN OPPORTUNITY OR WARNING SIGN? 22% BELOW ITS PEAK — WHAT SHOULD INVESTORS DO NOW?
Is this a temporary correction offering an accumulation opportunity, or could gold prices fall further?
Let's examine the historical performance, technical indicators and important price levels.
📊 1. WHERE DOES GOLDBEES STAND?
Long-term performance
Despite the recent correction, GoldBeES has delivered impressive historical returns. However, past performance does not guarantee future returns.
📉 2. WHY HAS GOLDBEES CORRECTED?
🔍 3. TECHNICAL INDICATORS: WHAT IS THE CHART SAYING?
Bollinger Bands
Other indicators
🎯 4. IMPORTANT SUPPORT & RESISTANCE LEVELS
🟢Support zones
🔴Resistance zones
These are approximate technical reference levels, not guaranteed price turning points.
📈 5. WHAT COULD HAPPEN NEXT?
Scenario 1: Bullish recovery
Scenario 2: Further correction
Scenario 3: Long-term accumulation
🌍 6. WHAT SHOULD GOLD INVESTORS WATCH?
💡 FINAL INVESTOR TAKEAWAY
The golden rule: Don't confuse a correction with the end of a long-term investment story—but don't assume every fall is a buying opportunity either.
📌 Watch ₹114.50 support and ₹119 resistance closely. The next directional move could provide important clues about GoldBeES's short-term trend.
#GoldBeES #GOLDBEES #GoldETF #GoldInvestment #GoldPrice #NipponIndiaETF #StockMarketIndia #TechnicalAnalysis #PortfolioDiversification #Investing #TradingView
*Disclaimer: For educational purposes only. Not a buy/sell recommendation. Consider your investment horizon, asset allocation and risk tolerance before investing.*
- Gold has been one of the biggest wealth-preservation stories over recent years.
- However, even gold is not immune to sharp corrections.
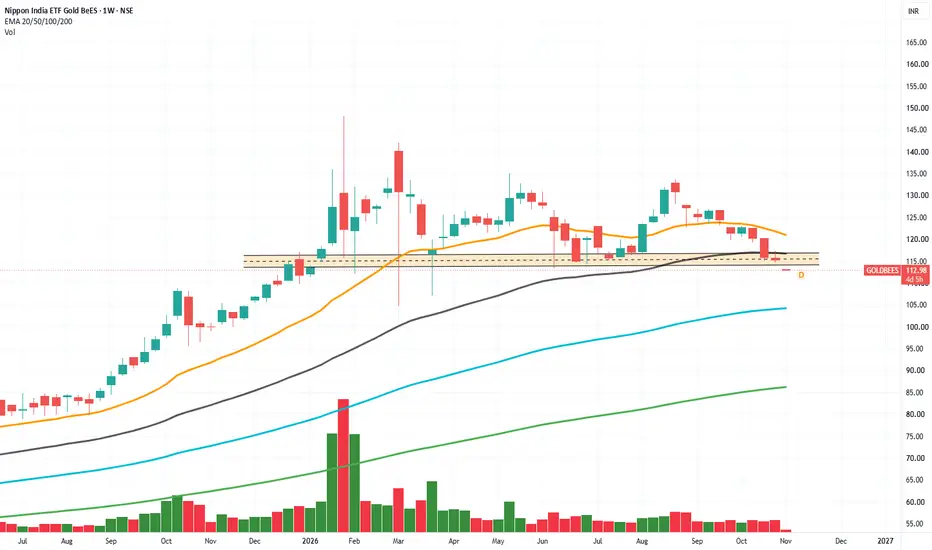
- After reaching a 52-week high of ₹148.14 in January 2026, GoldBeES has corrected significantly and is now showing signs of short-term weakness.
Is this a temporary correction offering an accumulation opportunity, or could gold prices fall further?
Let's examine the historical performance, technical indicators and important price levels.
📊 1. WHERE DOES GOLDBEES STAND?
- Latest closing price:₹115.23 (30 October 2026).
- 52-week high:₹148.14.
- 52-week low:Approximately ₹99.03 (some data providers report ₹97.30).
- Correction from the high:Approximately 22.2%.
- Recovery from the 52-week low:Approximately 16.3%.
Long-term performance
- 1-year return: Approximately +15.2%.
- 3-year return: Approximately +125.4%.
- 5-year return: Approximately +179.9%.
- 10-year return: Approximately +318%.
Despite the recent correction, GoldBeES has delivered impressive historical returns. However, past performance does not guarantee future returns.
📉 2. WHY HAS GOLDBEES CORRECTED?
- Several global factors have influenced the recent weakness in gold:
- Stronger US dollar: A stronger dollar can make internationally priced gold more expensive for buyers using other currencies.
- Higher US Treasury yields: Rising yields can reduce gold's relative attractiveness because gold does not generate interest income.
- Profit-booking: After a substantial rally, investors may choose to book profits.
- Reduced futures positioning: Changes in speculative positions can accelerate short-term price movements.
- Global market uncertainty: Geopolitical developments and changing monetary-policy expectations can cause sharp fluctuations in safe-haven demand.
- According to the World Gold Council's October 2026 update, international gold prices declined approximately 8.5% in September, while domestic gold prices fell around 4.8%.
- Nevertheless, gold ETF inflows remained positive through mid-October, indicating that investor interest had not completely disappeared.
🔍 3. TECHNICAL INDICATORS: WHAT IS THE CHART SAYING?
- Moving Averages – Short-term trend remains weak
- 20-day EMA: ₹118.79.
- 50-day EMA: ₹121.14.
- 100-day EMA: ₹121.83.
- 200-day EMA: ₹118.77.
- Current price is below all these moving averages.
- The ₹119–₹124 region represents an important resistance cluster.
- RSI (14): Approximately 31.18
- Momentum is weak and approaching oversold territory.
- A short-term relief rally is possible.
- A move above 40 could be an initial indication of improving momentum.
- An oversold RSI does not guarantee that prices have reached their bottom.
- MACD: Approximately −2.03
- Negative MACD indicates bearish momentum.
- The indicator remains below its signal line in the available technical snapshot.
- A bullish crossover supported by improving price and volume would strengthen the recovery outlook.
Bollinger Bands
- Upper band: ₹123.84.
- Middle band: ₹119.15.
- Lower band: ₹114.46.
- GoldBeES is trading close to its lower Bollinger Band, indicating weakness relative to its recent price range.
- A recovery from this region is possible, but continued movement below the lower band would be a warning sign.
Other indicators
- ATR (14): Approximately ₹1.38, indicating meaningful daily price fluctuations.
- ADX (14): Approximately 32.68, suggesting an established trend.
- MFI: Approximately 23.73, indicating weak money flow.
🎯 4. IMPORTANT SUPPORT & RESISTANCE LEVELS
🟢Support zones
- ₹114.50–₹115: Immediate support.
- ₹114–₹114.10: Secondary support reference.
- ₹113.40–₹113.50: Next downside reference.
🔴Resistance zones
- ₹115.80–₹116: Immediate resistance.
- ₹116.50–₹117.20: Short-term recovery hurdle.
- ₹118.70–₹119.20: Major moving-average resistance.
- ₹121–₹124: Strong resistance cluster.
- ₹135–₹148: Higher historical resistance zone.
These are approximate technical reference levels, not guaranteed price turning points.
📈 5. WHAT COULD HAPPEN NEXT?
Scenario 1: Bullish recovery
- GoldBeES holds ₹114.50–₹115.
- RSI begins recovering.
- Price moves above ₹117 with sustained buying.
- A stronger move above ₹119–₹121 could improve the technical outlook.
- A breakout above ₹124 would provide more convincing evidence of recovery.
Scenario 2: Further correction
- Price breaks below ₹114.50.
- Selling pressure increases.
- The next support references become ₹114 and ₹113.40.
- Persistent weakness could require investors to reassess their near-term expectations.
Scenario 3: Long-term accumulation
- Investors seeking gold exposure may consider staggered allocation instead of investing the entire amount at once.
- Monitor international gold prices, USD/INR and the ETF's premium or discount to indicative NAV.
- Maintain gold as part of a diversified portfolio rather than treating it as a guaranteed alternative to equities.
🌍 6. WHAT SHOULD GOLD INVESTORS WATCH?
- US dollar movement and Treasury yields.
- Federal Reserve interest-rate expectations.
- Global geopolitical developments.
- Central-bank gold purchases.
- Gold ETF inflows and outflows.
- Indian jewellery demand and seasonal buying.
- Rupee movement against the US dollar.
- These factors can influence both international gold prices and domestic GoldBeES performance.
💡 FINAL INVESTOR TAKEAWAY
- GoldBeES is approximately 22% below its 52-week high, but its short-term technical trend remains bearish.
- The RSI is approaching oversold territory, and the ETF is trading near its lower Bollinger Band. These conditions may create the possibility of a relief rally, but the moving averages and MACD have not yet confirmed a reversal.
- For long-term investors, gold may continue to serve as a portfolio-diversification asset. For short-term traders, confirmation above ₹117 and subsequently ₹119–₹124 would be important.
The golden rule: Don't confuse a correction with the end of a long-term investment story—but don't assume every fall is a buying opportunity either.
📌 Watch ₹114.50 support and ₹119 resistance closely. The next directional move could provide important clues about GoldBeES's short-term trend.
#GoldBeES #GOLDBEES #GoldETF #GoldInvestment #GoldPrice #NipponIndiaETF #StockMarketIndia #TechnicalAnalysis #PortfolioDiversification #Investing #TradingView
*Disclaimer: For educational purposes only. Not a buy/sell recommendation. Consider your investment horizon, asset allocation and risk tolerance before investing.*

Disclaimer
The information and publications are not meant to be, and do not constitute, financial, investment, trading, or other types of advice or recommendations supplied or endorsed by TradingView. Read more in the Terms of Use.
Disclaimer
The information and publications are not meant to be, and do not constitute, financial, investment, trading, or other types of advice or recommendations supplied or endorsed by TradingView. Read more in the Terms of Use.