
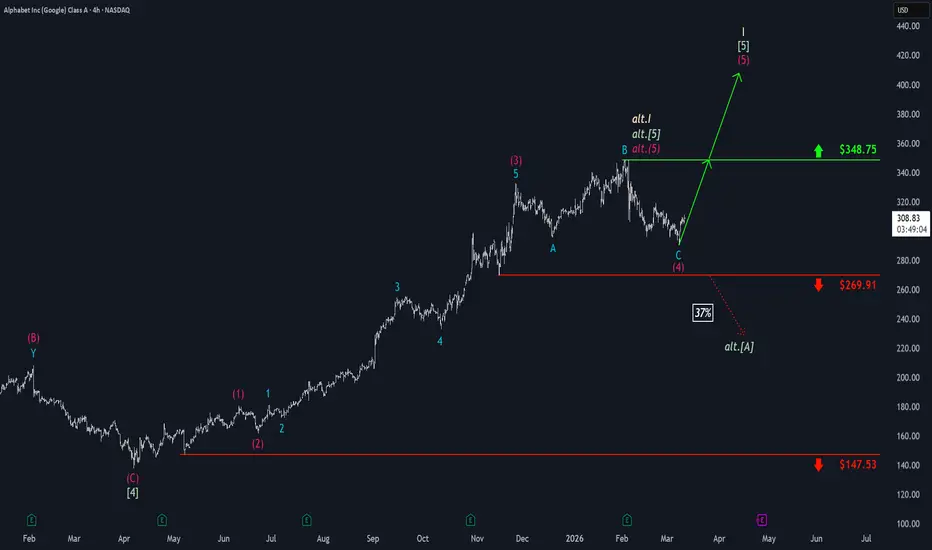
Google’s stock recently slipped to a fresh local low and showed an initial reaction to the upside from that level. Our primary scenario still assigns additional potential to the current smaller upward leg, as well as to the broader ongoing uptrend. We therefore anticipate step-by-step advances toward a new all-time high above the resistance at $348.75. In our alternative scenario, however, GOOGL may have already completed the uptrend and entered a broader bearish phase. In that case, further selling pressure would emerge, with declines extending below the support at $269.91. The probability of this scenario stands at 37%.

📊 Daily market insights combining macro + Elliott Wave analysis
🚀 Spot trends early with momentum, sentiment & price structure
🌐 Join thousands trading smarter at hkcmglobal.com
🚀 Spot trends early with momentum, sentiment & price structure
🌐 Join thousands trading smarter at hkcmglobal.com
Related publications
Disclaimer
The information and publications are not meant to be, and do not constitute, financial, investment, trading, or other types of advice or recommendations supplied or endorsed by TradingView. Read more in the Terms of Use.