
1. The Macro Perspective: The Multi-Month Accumulation Base
I am taking a LONG bias on Grasim Industries Limited (GRASIM) on the daily (1D) timeframe.
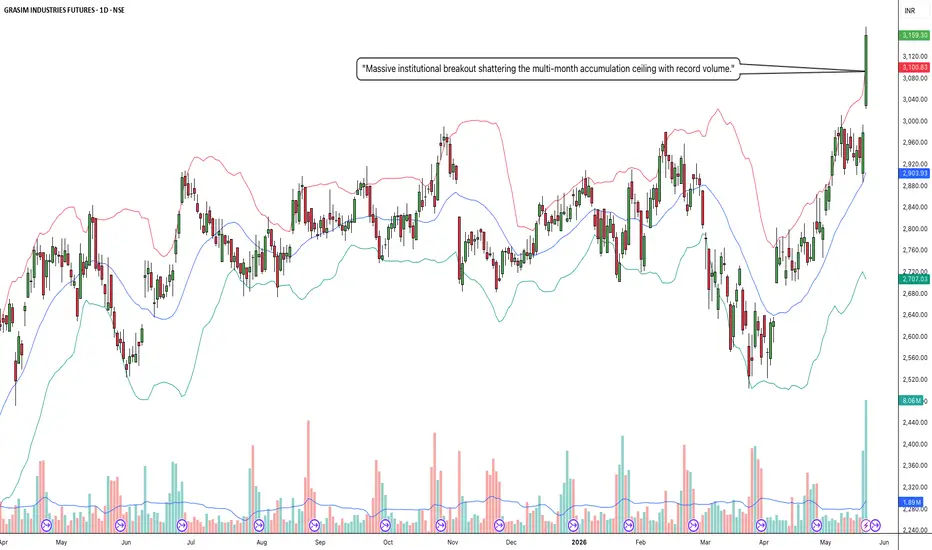
When analyzing pure market structure, the longest consolidation phases yield the most explosive trends. Look at the massive structural development spanning this entire chart. Since mid-2025, the stock has been locked in a massive horizontal distribution and accumulation block, capped by a formidable resistance ceiling around the 2,980 to 3,000 zone. Sellers repeatedly swatted the price down from this level in October, January, and early May. This prolonged sideways grinding acts as a massive washing machine—it exhausts impatient retail traders, allowing strong-handed institutional buyers to quietly absorb all available liquidity.
2. The Educational Setup: The Unmistakable Institutional Footprint
To understand the sheer technical validity of this current breakout, look at the mechanics aligning on the far right side of the chart:
The Volume Anomaly: Look at the volume pane at the bottom right. That massive, towering cyan volume bar is a structural anomaly. It represents the single highest daily volume allocation seen on this entire chart. That is the undeniable footprint of heavy institutional capital aggressively slamming the market order button.
The Bollinger Band Expansion: Prior to this move, the price tightly compressed against the middle 20 SMA, pinching the Bollinger Bands together. Volatility is entirely cyclical; a deep compression is always followed by a violent expansion. This massive candle has violently pierced and ridden outside the upper Bollinger Band, forcing the bands to snap wide open.
3. Current Price Action: Entering Pure Markup Phase
Look at the most recent daily candle on the far right. The momentum is absolutely ferocious. Buyers have effortlessly shattered the critical 3,000 psychological and technical barrier with a massive, full-bodied +6.04% green expansion candle, closing near the absolute high of the day at 3,159.30. By decisively clearing this multi-month structural ceiling, GRASIM has officially completed its accumulation phase and initiated a powerful new markup cycle. All major overhead historical supply has been completely absorbed.
4. The Trade Plan: Entries, Targets, and Risk Management
Entry Strategy: Momentum is exceptionally strong right now near 3,159.30. Chasing a vertical +6% candle that is closing entirely outside the daily upper Bollinger Band carries an immediate risk of an intraday or daily mean-reversion pullback as the stock naturally breathes. The highest-probability, lowest-risk entry involves stepping down to lower timeframes (like the 75m or 15m visible on your tabs) and waiting for a minor structural pullback to perfectly retest the 2,980 to 3,020 broken resistance block. Letting that heavy historical ceiling prove itself as an indestructible support floor offers a phenomenal risk-to-reward ratio.
Take Profit (Targets): We use a measured move strategy based on the depth of the accumulation base. By taking the depth of the multi-month range (roughly 480 points from the late-March swing low of ~2,520 up to the 3,000 ceiling) and projecting it upward from the breakout point, our primary structural macro target sits comfortably in the 3,480 to 3,500 zone. The immediate psychological milestone will be 3,300.
Invalidation (Stop Loss): A range breakout thesis is only valid if the new market structure holds. A hard stop loss should be placed safely below the breakout zone and the middle Bollinger Band (20 SMA), around the 2,880 to 2,920 level. A definitive daily close completely back inside the old range below 2,850 would act as a massive warning sign of a failed breakout and a severe bull trap.
5. Time Horizon:
Because this technical setup is built on a 1-Day chart capturing an explosive multi-month range breakout backed by record institutional volume, this is a highly aggressive short-to-medium-term swing trade designed to ride the new trend continuation. Let the markup phase run!
I am taking a LONG bias on Grasim Industries Limited (GRASIM) on the daily (1D) timeframe.
When analyzing pure market structure, the longest consolidation phases yield the most explosive trends. Look at the massive structural development spanning this entire chart. Since mid-2025, the stock has been locked in a massive horizontal distribution and accumulation block, capped by a formidable resistance ceiling around the 2,980 to 3,000 zone. Sellers repeatedly swatted the price down from this level in October, January, and early May. This prolonged sideways grinding acts as a massive washing machine—it exhausts impatient retail traders, allowing strong-handed institutional buyers to quietly absorb all available liquidity.
2. The Educational Setup: The Unmistakable Institutional Footprint
To understand the sheer technical validity of this current breakout, look at the mechanics aligning on the far right side of the chart:
The Volume Anomaly: Look at the volume pane at the bottom right. That massive, towering cyan volume bar is a structural anomaly. It represents the single highest daily volume allocation seen on this entire chart. That is the undeniable footprint of heavy institutional capital aggressively slamming the market order button.
The Bollinger Band Expansion: Prior to this move, the price tightly compressed against the middle 20 SMA, pinching the Bollinger Bands together. Volatility is entirely cyclical; a deep compression is always followed by a violent expansion. This massive candle has violently pierced and ridden outside the upper Bollinger Band, forcing the bands to snap wide open.
3. Current Price Action: Entering Pure Markup Phase
Look at the most recent daily candle on the far right. The momentum is absolutely ferocious. Buyers have effortlessly shattered the critical 3,000 psychological and technical barrier with a massive, full-bodied +6.04% green expansion candle, closing near the absolute high of the day at 3,159.30. By decisively clearing this multi-month structural ceiling, GRASIM has officially completed its accumulation phase and initiated a powerful new markup cycle. All major overhead historical supply has been completely absorbed.
4. The Trade Plan: Entries, Targets, and Risk Management
Entry Strategy: Momentum is exceptionally strong right now near 3,159.30. Chasing a vertical +6% candle that is closing entirely outside the daily upper Bollinger Band carries an immediate risk of an intraday or daily mean-reversion pullback as the stock naturally breathes. The highest-probability, lowest-risk entry involves stepping down to lower timeframes (like the 75m or 15m visible on your tabs) and waiting for a minor structural pullback to perfectly retest the 2,980 to 3,020 broken resistance block. Letting that heavy historical ceiling prove itself as an indestructible support floor offers a phenomenal risk-to-reward ratio.
Take Profit (Targets): We use a measured move strategy based on the depth of the accumulation base. By taking the depth of the multi-month range (roughly 480 points from the late-March swing low of ~2,520 up to the 3,000 ceiling) and projecting it upward from the breakout point, our primary structural macro target sits comfortably in the 3,480 to 3,500 zone. The immediate psychological milestone will be 3,300.
Invalidation (Stop Loss): A range breakout thesis is only valid if the new market structure holds. A hard stop loss should be placed safely below the breakout zone and the middle Bollinger Band (20 SMA), around the 2,880 to 2,920 level. A definitive daily close completely back inside the old range below 2,850 would act as a massive warning sign of a failed breakout and a severe bull trap.
5. Time Horizon:
Because this technical setup is built on a 1-Day chart capturing an explosive multi-month range breakout backed by record institutional volume, this is a highly aggressive short-to-medium-term swing trade designed to ride the new trend continuation. Let the markup phase run!

Disclaimer
The information and publications are not meant to be, and do not constitute, financial, investment, trading, or other types of advice or recommendations supplied or endorsed by TradingView. Read more in the Terms of Use.
Disclaimer
The information and publications are not meant to be, and do not constitute, financial, investment, trading, or other types of advice or recommendations supplied or endorsed by TradingView. Read more in the Terms of Use.