
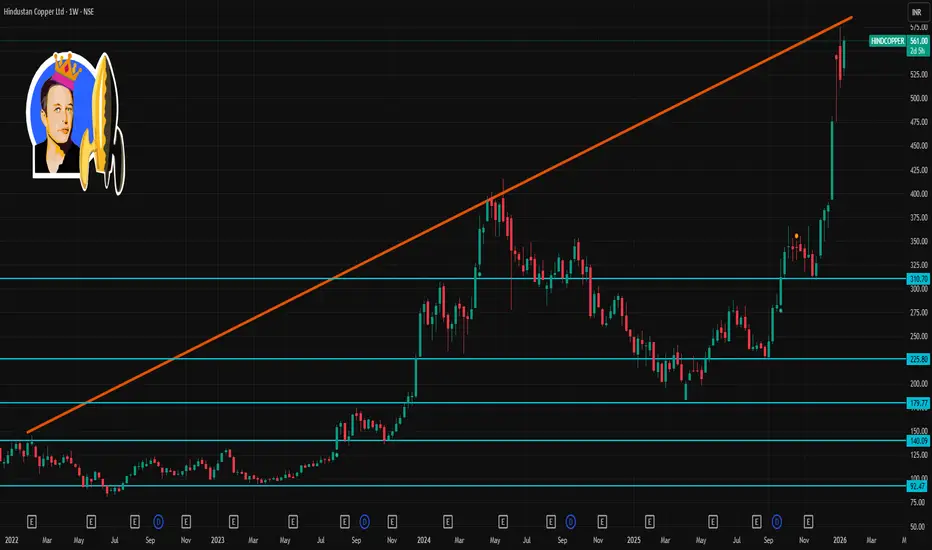
📈 Current Price (Approximate)
~₹555–₹562 per share (live intraday range) — price has recently bounced and remains elevated near short‑term highs.
🎯 1‑Week Timeframe Levels (Short‑Term View)
🟢 Resistance (Upside)
These are key zones where the stock might face selling pressure this week:
1. R1: ~₹568–₹572 — first major resistance above current levels.
2. R2: ~₹585–₹588 — next technical resistance if price sustains above near term.
3. R3: ~₹595–₹600+ — a higher breakout zone (psychological/technical barrier).
🔹 A sustained weekly close above ~₹568–₹572 would improve bullish momentum and open room toward ₹585–₹600+.
🔴 Support (Downside)
These are key floors where buyers may step in on a pullback:
1. S1: ~₹531–₹532 — immediate near‑term support from pivot and prior consolidation bands.
2. S2: ~₹523–₹525 — secondary support if short‑term pullback deepens.
3. S3: ~₹511–₹514 — stronger support area beyond typical weekly pullbacks.
🔹 A weekly close below ~₹523–₹525 risks extending short‑term selling toward ₹511–₹514.
📝 Interpretation for the Coming Week
Bullish scenario:
✅ If price trades and closes above ~₹568–₹572 → watch breakout toward ₹585–₹600+
Neutral/Range scenario:
➡ Price may consolidate between ~₹531 and ₹568 if neither strong breakout nor breakdown emerges.
Bearish scenario:
❌ A weekly downside close below ~₹523–₹525 may accelerate pullbacks toward ₹511–₹514

Contact Knowledgehub for a detailed consultation: Dm on WhatsApp: [wa.link/a2o0kz]-
Phone No: [+91 93102 26243]-
Email: [tradingviewknowledgehub@gmail.com]---
-- Let’s achieve success together!
Phone No: [+91 93102 26243]-
Email: [tradingviewknowledgehub@gmail.com]---
-- Let’s achieve success together!
Related publications
Disclaimer
The information and publications are not meant to be, and do not constitute, financial, investment, trading, or other types of advice or recommendations supplied or endorsed by TradingView. Read more in the Terms of Use.