
Hindustan Petroleum Corporation Ltd – Weekly Chart AnalysisPrice
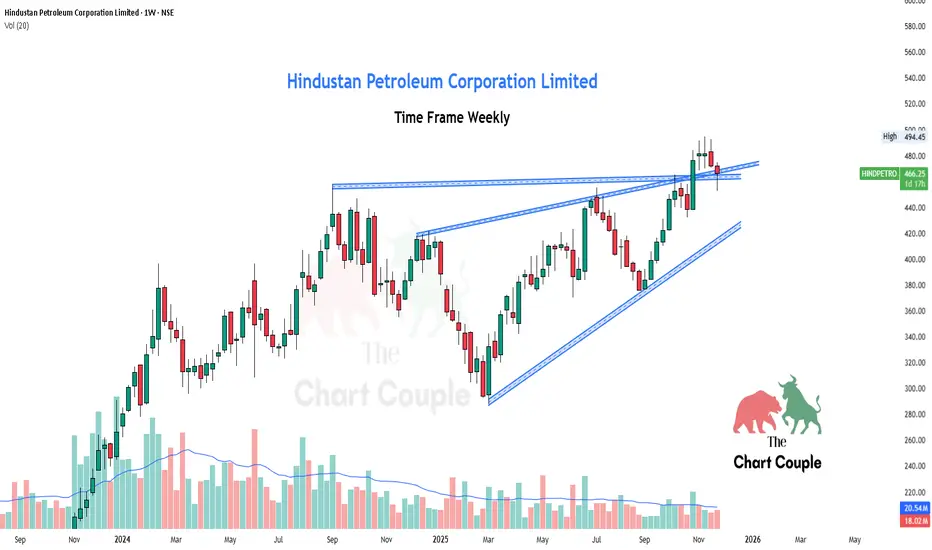
Price has been moving inside a rising wedge structure, forming higher highs & higher lows over the past several months. Recently, the stock attempted a breakout above the wedge resistance but is now trading near the upper trendline, showing signs of pullback or retest behavior.
Volume has remained moderate, suggesting the market is waiting for a clear direction.
Now price action is at a decision zone — either a successful retest could resume bullish momentum, or failure may lead to profit-booking and a slide toward lower support trendlines.
This zone becomes crucial for directional clarity.
Volume has remained moderate, suggesting the market is waiting for a clear direction.
Now price action is at a decision zone — either a successful retest could resume bullish momentum, or failure may lead to profit-booking and a slide toward lower support trendlines.
This zone becomes crucial for directional clarity.

Disclaimer
The information and publications are not meant to be, and do not constitute, financial, investment, trading, or other types of advice or recommendations supplied or endorsed by TradingView. Read more in the Terms of Use.
Disclaimer
The information and publications are not meant to be, and do not constitute, financial, investment, trading, or other types of advice or recommendations supplied or endorsed by TradingView. Read more in the Terms of Use.