
________________________________________
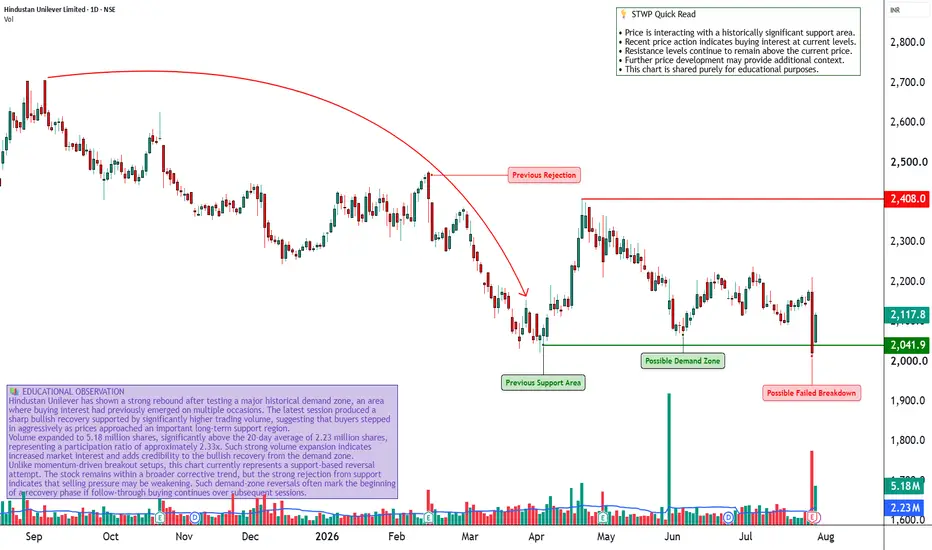
📊 Hindustan Unilever Ltd. (HUL): Daily Technical Snapshot – Demand Zone Reversal
📊 STWP Technical Analysis
________________________________________
MARKET STRUCTURE SNAPSHOT | NSE: HINDUNILVR | DAILY
Closing Price:2,117.80 (+₹95.10 | +4.70%)
Core Trend: Downtrend (Long-Term Correction)
Market State: Recovery from Major Demand Zone
Price Structure: Price has rebounded sharply after testing a historically significant Demand Zone, indicating renewed buying interest. The latest bullish candle suggests a potential reversal attempt, although confirmation would require sustained strength above nearby resistance levels.
________________________________________
OPERATIONAL PRICE GRID & KEY REFERENCE LEVELS
Model Reference Level:2,123.00
Hard Invalidation Level:2,013.40
Structural Risk:109.60 (5.16%)
Resistance Levels: R12,144.87 | R22,171.93 | R32,220.87
Support Levels: S12,068.87 | S22,019.93 | S31,992.87
Range Structure: Low2,013.40 | High2,220.87
Higher Timeframe Observation Zones:2,220 |2,300 |2,408
________________________________________
⚠️ Disclaimer
This analysis is provided strictly for educational and informational purposes.
It does not constitute financial, investment or trading advice and should not be interpreted as a recommendation to buy or sell any security. Stock market investments are subject to market risks, including the possible loss of capital. Historical performance, chart patterns and technical indicators do not guarantee future outcomes. Please conduct your own research and consult a SEBI-registered investment adviser before making investment decisions.
STWP assumes no responsibility or liability for any financial loss arising directly or indirectly from the use of this analysis.
📊 Hindustan Unilever Ltd. (HUL): Daily Technical Snapshot – Demand Zone Reversal
📊 STWP Technical Analysis
________________________________________
MARKET STRUCTURE SNAPSHOT | NSE: HINDUNILVR | DAILY
Closing Price:2,117.80 (+₹95.10 | +4.70%)
Core Trend: Downtrend (Long-Term Correction)
Market State: Recovery from Major Demand Zone
Price Structure: Price has rebounded sharply after testing a historically significant Demand Zone, indicating renewed buying interest. The latest bullish candle suggests a potential reversal attempt, although confirmation would require sustained strength above nearby resistance levels.
________________________________________
OPERATIONAL PRICE GRID & KEY REFERENCE LEVELS
Model Reference Level:2,123.00
Hard Invalidation Level:2,013.40
Structural Risk:109.60 (5.16%)
Resistance Levels: R12,144.87 | R22,171.93 | R32,220.87
Support Levels: S12,068.87 | S22,019.93 | S31,992.87
Range Structure: Low2,013.40 | High2,220.87
Higher Timeframe Observation Zones:2,220 |2,300 |2,408
________________________________________
⚠️ Disclaimer
This analysis is provided strictly for educational and informational purposes.
It does not constitute financial, investment or trading advice and should not be interpreted as a recommendation to buy or sell any security. Stock market investments are subject to market risks, including the possible loss of capital. Historical performance, chart patterns and technical indicators do not guarantee future outcomes. Please conduct your own research and consult a SEBI-registered investment adviser before making investment decisions.
STWP assumes no responsibility or liability for any financial loss arising directly or indirectly from the use of this analysis.

STWP | Mentor & Demand-Supply Specialist |
Empowering traders through structured learning |
simpletradewithpatience.com
chat.whatsapp.com/CpgyHCfioQ5Hxf7rd8pDqw
wa.me/message/6IOPHGOXMGZ4N1
Educational Only
Empowering traders through structured learning |
simpletradewithpatience.com
chat.whatsapp.com/CpgyHCfioQ5Hxf7rd8pDqw
wa.me/message/6IOPHGOXMGZ4N1
Educational Only
Related publications
Disclaimer
The information and publications are not meant to be, and do not constitute, financial, investment, trading, or other types of advice or recommendations supplied or endorsed by TradingView. Read more in the Terms of Use.
STWP | Mentor & Demand-Supply Specialist |
Empowering traders through structured learning |
simpletradewithpatience.com
chat.whatsapp.com/CpgyHCfioQ5Hxf7rd8pDqw
wa.me/message/6IOPHGOXMGZ4N1
Educational Only
Empowering traders through structured learning |
simpletradewithpatience.com
chat.whatsapp.com/CpgyHCfioQ5Hxf7rd8pDqw
wa.me/message/6IOPHGOXMGZ4N1
Educational Only
Related publications
Disclaimer
The information and publications are not meant to be, and do not constitute, financial, investment, trading, or other types of advice or recommendations supplied or endorsed by TradingView. Read more in the Terms of Use.