
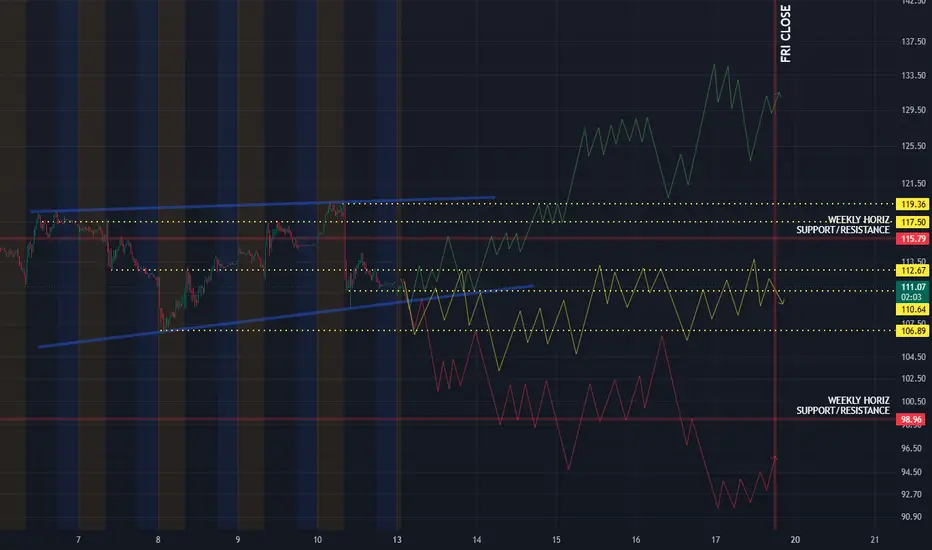
HOOD is sitting right on a key decision zone after a sharp intraday selloff and rebound attempts around the $111.00 area. The chart shows major weekly lines being tested, with nearby support at $110.64 and $106.89, while resistance sits overhead at $112.67, $115.79, and the bigger weekly shelf at $117.50.
Earnings are in 16 days, so this setup can stay reactive to headline flow and positioning as we move through this week.
I've mapped out three scenarios for the coming sessions:
🟢 Bullish Scenario (My Lean)
This is the scenario I'm leaning toward. If HOOD can hold above $110.64 and reclaim $112.67 with strength, I’d look for a push into $115.79 and then the $117.50 weekly horizontal. A clean break and hold above $117.50 opens the door for a continuation move toward the $119.36 area and possibly higher if momentum expands.
🔴 Bearish Scenario
If $110.64 fails and price starts accepting below the $108.69/$106.89 support band, the chart opens up to a deeper flush. In that case, I’d expect sellers to target the $98.96 weekly support zone first, with $105.00 and the low $100s acting as intraday waypoints on the way down.
🟡 Sideways Scenario
This is the scenario that frustrates everyone. HOOD could remain boxed between roughly $110.64 and $115.79, chopping around the $111.02 midpoint while both calls and puts get punished by theta decay. That kind of range would likely keep the stock pinned until a catalyst or a clear break of the weekly levels forces direction.
Earnings & Implied Move
With earnings still 16 days away, implied volatility can stay elevated but also vulnerable to sudden expansion or a pre-earnings fade, followed by IV crush once the report hits.
My Outlook
If I had to rank the probabilities today:
🟢 Bullish (my current lean)
🟡 Sideways consolidation
🔴 Bearish
That ranking can change quickly if HOOD loses $110.64 and fails to reclaim $112.67, or if it starts accepting above $115.79 and $117.50 with momentum.
As always, the Heavy Diligence Options Signals Indicator will be my primary tool for entries and exits. While these scenarios provide the broader roadmap, the indicator is designed primarily for day trading on shorter timeframes, helping identify higher-probability Call and Put opportunities. Combining those signals with key technical levels helps improve risk management instead of simply guessing the next move.
Disclaimer: This is only my interpretation of the current chart and is not financial advice. Always do your own research, wait for confirmation, and manage your risk before entering any trade.
Earnings are in 16 days, so this setup can stay reactive to headline flow and positioning as we move through this week.
I've mapped out three scenarios for the coming sessions:
🟢 Bullish Scenario (My Lean)
This is the scenario I'm leaning toward. If HOOD can hold above $110.64 and reclaim $112.67 with strength, I’d look for a push into $115.79 and then the $117.50 weekly horizontal. A clean break and hold above $117.50 opens the door for a continuation move toward the $119.36 area and possibly higher if momentum expands.
🔴 Bearish Scenario
If $110.64 fails and price starts accepting below the $108.69/$106.89 support band, the chart opens up to a deeper flush. In that case, I’d expect sellers to target the $98.96 weekly support zone first, with $105.00 and the low $100s acting as intraday waypoints on the way down.
🟡 Sideways Scenario
This is the scenario that frustrates everyone. HOOD could remain boxed between roughly $110.64 and $115.79, chopping around the $111.02 midpoint while both calls and puts get punished by theta decay. That kind of range would likely keep the stock pinned until a catalyst or a clear break of the weekly levels forces direction.
Earnings & Implied Move
With earnings still 16 days away, implied volatility can stay elevated but also vulnerable to sudden expansion or a pre-earnings fade, followed by IV crush once the report hits.
My Outlook
If I had to rank the probabilities today:
🟢 Bullish (my current lean)
🟡 Sideways consolidation
🔴 Bearish
That ranking can change quickly if HOOD loses $110.64 and fails to reclaim $112.67, or if it starts accepting above $115.79 and $117.50 with momentum.
As always, the Heavy Diligence Options Signals Indicator will be my primary tool for entries and exits. While these scenarios provide the broader roadmap, the indicator is designed primarily for day trading on shorter timeframes, helping identify higher-probability Call and Put opportunities. Combining those signals with key technical levels helps improve risk management instead of simply guessing the next move.
Disclaimer: This is only my interpretation of the current chart and is not financial advice. Always do your own research, wait for confirmation, and manage your risk before entering any trade.

Disclaimer
The information and publications are not meant to be, and do not constitute, financial, investment, trading, or other types of advice or recommendations supplied or endorsed by TradingView. Read more in the Terms of Use.
Disclaimer
The information and publications are not meant to be, and do not constitute, financial, investment, trading, or other types of advice or recommendations supplied or endorsed by TradingView. Read more in the Terms of Use.