
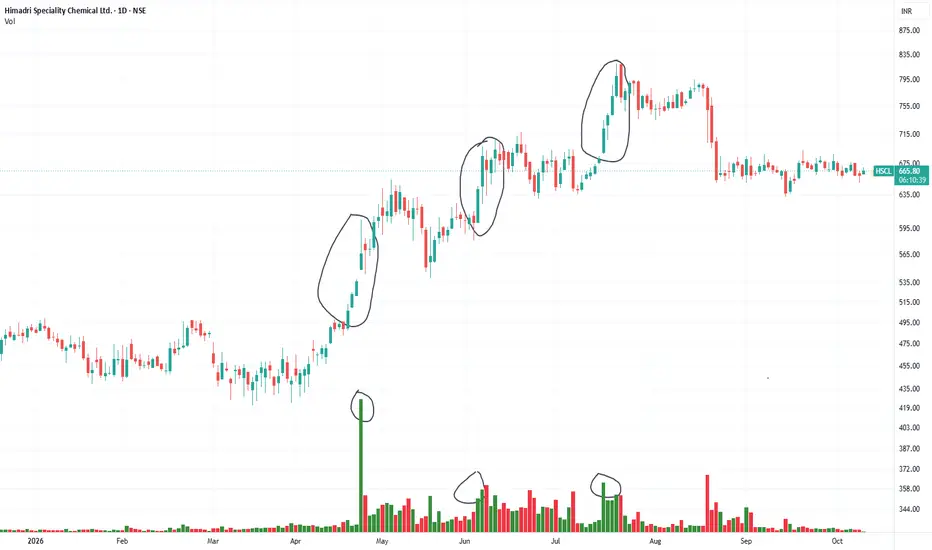
Introduction:
The first lesson: waiting is part of trading
The volume spurt: watch when participation changes
Note:
The days that decide the move
What should a trader observe?
What happened after the July rally?
What does HSCL's current chart suggest?
₹650–₹660: An initial area to watch for support, based on the recent consolidation.
₹675–₹690: An immediate resistance zone where the price has repeatedly struggled to move higher.
₹700–₹715: A more meaningful recovery zone if the stock first clears nearby resistance.
₹755–₹790: A higher resistance area associated with the previous trading range.
Bullish development: A strong daily close above the ₹680–₹690 zone, supported by expanding volume and follow-through buying, would be an initial positive signal. A sustained move above ₹700–₹715 would provide stronger evidence of recovery.
Bearish development: A convincing break below ₹650, particularly on elevated selling volume, would weaken the current consolidation structure. The region around ₹635 becomes another level to watch.
Neutral development: If the stock continues to move between roughly ₹650 and ₹680 on ordinary volume, waiting for a confirmed breakout or breakdown may be more sensible than anticipating one.
The real trading lesson
Key takeaways from HSCL Chart:
The chart highlights three rules worth remembering:
- When you look closely at the daily chart of Himadri Speciality Chemical Ltd. (HSCL).
- The price action illustrates a powerful market lesson.
- Most of the excitement—and a substantial part of a stock's advance—can occur during a relatively small number of trading sessions.
The first lesson: waiting is part of trading
- For weeks, HSCL traded mostly within a broad range around ₹430–₹495.
- The stock did not offer an obvious, sustained uptrend during much of this period.
- Then came a sharp advance from around ₹490 towards ₹600.
- After another period of consolidation, the stock pushed towards ₹700 in June.
- A subsequent breakout in July carried it towards ₹800–₹820.
- The important observation is that the price did not rise at the same pace every day. Long periods of waiting were followed by short, powerful bursts of movement.
- Investors who lose patience during consolidation may exit just before a breakout. Those who buy impulsively after a large green candle, on the other hand, may enter just as the immediate move is becoming extended.
The volume spurt: watch when participation changes
- The circled volume bars are among the most interesting parts of this chart.
- First major volume expansion: It coincided with the move out of the ₹490 region towards ₹600. The sudden increase in trading activity suggested that the breakout was attracting significant participation.
- Second volume expansion: Higher activity accompanied the advance towards ₹700. This strengthened the significance of that price move.
- Third volume expansion: The July surge towards ₹800 occurred alongside another noticeable pickup in volume.
- These are examples of why traders study volume alongside price.
- A breakout accompanied by unusually high volume can carry more conviction than a breakout on weak participation.
Note:
- Volume itself is not automatically bullish.
- A large volume bar can reflect aggressive buying, heavy selling, profit-booking or a transfer of shares between buyers and sellers.
- The direction of the candle, the closing price and what happens in the following sessions help determine its meaning.
The days that decide the move
- A stock may spend 20 sessions moving sideways and then make its most important move in three or four sessions. Those breakout sessions can change the entire chart structure.
What should a trader observe?
- Is price crossing a clearly defined resistance zone?
- Is volume expanding compared with recent sessions?
- Is the stock closing near the upper end of its daily range?
- Does it hold above the breakout level over the following sessions?
- Does the next advance receive buying support, or does the price immediately fall back into its earlier range?
- The final question matters enormously.
- A large green candle is interesting; a breakout that holds is more meaningful.
What happened after the July rally?
- HSCL climbed towards ₹800–₹820, but the move did not continue indefinitely.
- The chart then shows a sharp decline during August, accompanied by a major volume spike, followed by sideways trading.
- That sequence is an important warning against blindly assuming that high volume always means accumulation.
- The heavy-volume decline suggests that significant selling pressure was present. Since then, HSCL has largely consolidated around ₹650–₹680 rather than reclaiming its earlier highs.
- In other words, the chart has moved from a powerful advance to a period of consolidation following a sharp correction. The next directional move needs confirmation.
What does HSCL's current chart suggest?
₹650–₹660: An initial area to watch for support, based on the recent consolidation.
₹675–₹690: An immediate resistance zone where the price has repeatedly struggled to move higher.
₹700–₹715: A more meaningful recovery zone if the stock first clears nearby resistance.
₹755–₹790: A higher resistance area associated with the previous trading range.
Bullish development: A strong daily close above the ₹680–₹690 zone, supported by expanding volume and follow-through buying, would be an initial positive signal. A sustained move above ₹700–₹715 would provide stronger evidence of recovery.
Bearish development: A convincing break below ₹650, particularly on elevated selling volume, would weaken the current consolidation structure. The region around ₹635 becomes another level to watch.
Neutral development: If the stock continues to move between roughly ₹650 and ₹680 on ordinary volume, waiting for a confirmed breakout or breakdown may be more sensible than anticipating one.
The real trading lesson
- Do not confuse activity with opportunity. A trader can take several unnecessary trades during a sideways market and still miss the one session that genuinely changes the trend.
- The better approach is to identify the range, mark the resistance and support, observe volume, and wait for price to confirm its next move. A breakout still needs risk management; even a high-volume breakout can fail.
- The market does not pay you for being busy. It rewards good decisions, disciplined waiting and risk control.
- You cannot know in advance which three or four sessions will make the move. But you can prepare before they arrive—and recognise the evidence when they do.
Key takeaways from HSCL Chart:
The chart highlights three rules worth remembering:
- Wait for the setup: Consolidation is not necessarily a reason to trade; sometimes it is a reason to observe.
- Respect the volume spurt: Look for a meaningful change in participation, but interpret it alongside price direction and the subsequent candles.
- Demand confirmation: HSCL's current sideways range is not yet the same as a fresh, confirmed uptrend. A high-volume breakout that holds would be more convincing than a single sharp rise.

Disclaimer
The information and publications are not meant to be, and do not constitute, financial, investment, trading, or other types of advice or recommendations supplied or endorsed by TradingView. Read more in the Terms of Use.
Disclaimer
The information and publications are not meant to be, and do not constitute, financial, investment, trading, or other types of advice or recommendations supplied or endorsed by TradingView. Read more in the Terms of Use.