
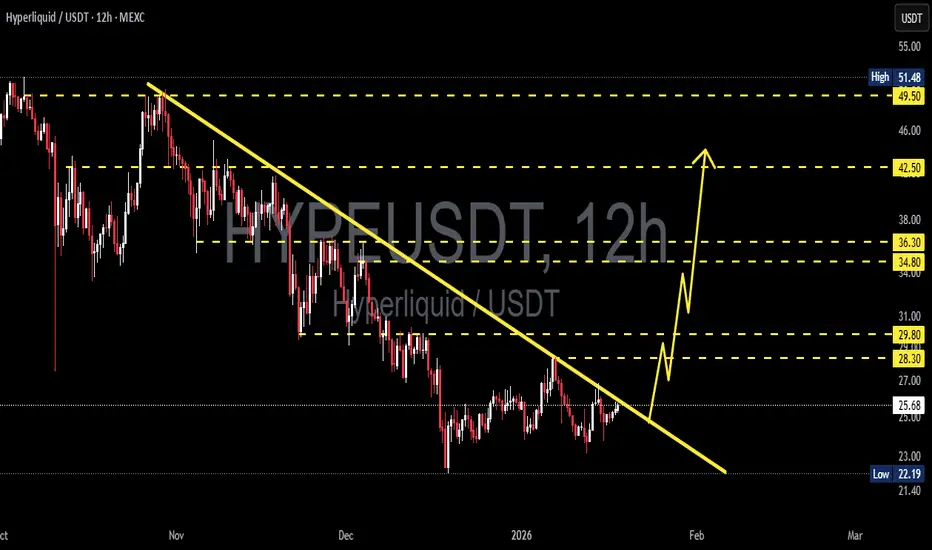
HYPE/USDT on the 12-hour timeframe remains in a clear bearish trend following a strong rejection from the 49.50 – 51.48 high zone. Price structure continues to form lower highs and lower lows, confirming sustained selling pressure. Currently, price is trading around 25.70, approaching a key area that could determine the next major move.
---
Pattern Explanation
The dominant pattern is a Descending Trendline / Bearish Structure:
A well-defined downward trendline connecting successive lower highs since November.
Multiple pullbacks toward the trendline have failed, reinforcing strong resistance.
This structure reflects controlled distribution and consistent seller dominance.
Additionally, price is forming a minor consolidation range near the lower zone (approximately 24.50 – 26.50), which may act as:
A temporary base for a technical rebound, or
A continuation zone before another bearish breakdown.
---
Key Levels
Resistance Levels:
28.30 → Minor resistance / rejection zone
29.80 → Key mid-term resistance
34.80 – 36.30 → Strong supply zone
42.50 & 49.50 → Major resistance / previous highs
Support Levels:
25.00 – 24.50 → Short-term support (current range)
22.19 → Major low / strong demand zone
---
Bullish Scenario
The bullish scenario becomes valid only with a confirmed breakout above the descending trendline:
1. Price holds above 28.30
2. Follow-through breakout above 29.80
3. Upside targets:
34.80
36.30
Such a move would signal:
Weakening bearish momentum
Potential trend reversal or corrective rally
Until a confirmed breakout occurs, bullish moves remain counter-trend.
---
Bearish Scenario
The bearish scenario remains dominant as long as price stays below the trendline:
1. Rejection from the 27.50 – 28.30 area
2. Breakdown below 25.00 support
3. Downside targets:
22.19 (major low)
Further downside if this level fails
This would confirm a bearish continuation pattern.
---
Conclusion
HYPE/USDT remains within a well-structured downtrend, with sellers maintaining control. The current price zone represents a critical decision area:
Trendline breakout → potential reversal or relief rally
Rejection and support breakdown → continuation of the bearish trend
Waiting for clear confirmation is recommended before committing to higher-risk positions.
#HYPEUSDT #Hyperliquid #CryptoAnalysis #TechnicalAnalysis #Downtrend #BearishTrend #TrendlineBreak #SupportResistance #AltcoinAnalysis
---
Pattern Explanation
The dominant pattern is a Descending Trendline / Bearish Structure:
A well-defined downward trendline connecting successive lower highs since November.
Multiple pullbacks toward the trendline have failed, reinforcing strong resistance.
This structure reflects controlled distribution and consistent seller dominance.
Additionally, price is forming a minor consolidation range near the lower zone (approximately 24.50 – 26.50), which may act as:
A temporary base for a technical rebound, or
A continuation zone before another bearish breakdown.
---
Key Levels
Resistance Levels:
28.30 → Minor resistance / rejection zone
29.80 → Key mid-term resistance
34.80 – 36.30 → Strong supply zone
42.50 & 49.50 → Major resistance / previous highs
Support Levels:
25.00 – 24.50 → Short-term support (current range)
22.19 → Major low / strong demand zone
---
Bullish Scenario
The bullish scenario becomes valid only with a confirmed breakout above the descending trendline:
1. Price holds above 28.30
2. Follow-through breakout above 29.80
3. Upside targets:
34.80
36.30
Such a move would signal:
Weakening bearish momentum
Potential trend reversal or corrective rally
Until a confirmed breakout occurs, bullish moves remain counter-trend.
---
Bearish Scenario
The bearish scenario remains dominant as long as price stays below the trendline:
1. Rejection from the 27.50 – 28.30 area
2. Breakdown below 25.00 support
3. Downside targets:
22.19 (major low)
Further downside if this level fails
This would confirm a bearish continuation pattern.
---
Conclusion
HYPE/USDT remains within a well-structured downtrend, with sellers maintaining control. The current price zone represents a critical decision area:
Trendline breakout → potential reversal or relief rally
Rejection and support breakdown → continuation of the bearish trend
Waiting for clear confirmation is recommended before committing to higher-risk positions.
#HYPEUSDT #Hyperliquid #CryptoAnalysis #TechnicalAnalysis #Downtrend #BearishTrend #TrendlineBreak #SupportResistance #AltcoinAnalysis

✅ Get Free Signals! Join Our Telegram Channel Here: t.me/TheCryptoNuclear
✅ Twitter: twitter.com/crypto_nuclear
✅ Join Bybit : partner.bybit.com/b/nuclearvip
✅ Benefits : Lifetime Trading Fee Discount -50%
✅ Twitter: twitter.com/crypto_nuclear
✅ Join Bybit : partner.bybit.com/b/nuclearvip
✅ Benefits : Lifetime Trading Fee Discount -50%
Disclaimer
The information and publications are not meant to be, and do not constitute, financial, investment, trading, or other types of advice or recommendations supplied or endorsed by TradingView. Read more in the Terms of Use.
✅ Get Free Signals! Join Our Telegram Channel Here: t.me/TheCryptoNuclear
✅ Twitter: twitter.com/crypto_nuclear
✅ Join Bybit : partner.bybit.com/b/nuclearvip
✅ Benefits : Lifetime Trading Fee Discount -50%
✅ Twitter: twitter.com/crypto_nuclear
✅ Join Bybit : partner.bybit.com/b/nuclearvip
✅ Benefits : Lifetime Trading Fee Discount -50%
Disclaimer
The information and publications are not meant to be, and do not constitute, financial, investment, trading, or other types of advice or recommendations supplied or endorsed by TradingView. Read more in the Terms of Use.