
1. The Macro Perspective: The Deep Washout and the Cup
I am taking a LONG bias on Vodafone Idea Ltd (IDEA) on the daily (1D) timeframe.
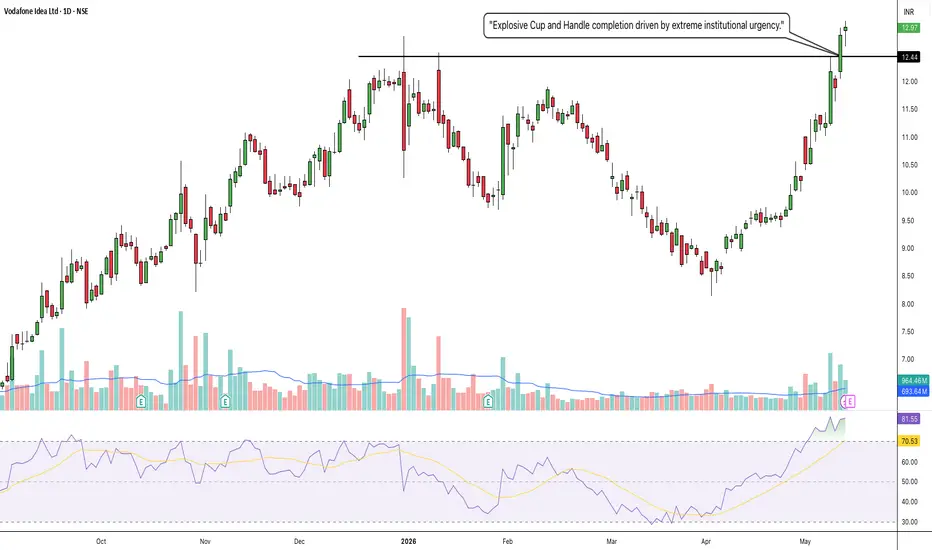
When analyzing pure market structure, the most reliable reversals occur when a stock forms a massive, rounded base. Look at the structural development on this chart. After a prior run-up, the stock suffered a deep, highly volatile markdown phase that dragged the price all the way down toward the 8.00 level. This brutal correction successfully washed out weak hands and impatient retail buyers. However, instead of collapsing further, the stock found an absolute floor and initiated a methodical, multi-month process of bottom accumulation, carving out an enormous "Cup" structure to march right back to the scene of the crime.
2. The Educational Setup: The Ceiling and the Volume
To understand the sheer strength of this current breakout, look at the mechanics of the resistance and the institutional footprints left behind:
The Accumulation Lid: For months, the stock's recovery was heavily capped by the formidable solid black resistance line at 12.44. Sellers aggressively defended this zone, creating the ultimate accumulation ceiling.
The Institutional Footprint: Look at the volume profile at the bottom of the chart. On the exact day the price pushed through the 12.44 ceiling, there was an absolute explosion in buying volume. Retail traders cannot generate that kind of volume; that is the undeniable footprint of heavy institutional capital forcing the stock into a new markup phase.
3. Current Price Action: Breakout and Boiling Indicators
Look at the most recent daily candles on the far right. The pressure cooker has absolutely exploded, pushing the price straight toward the 13.00 mark. By decisively clearing this massive accumulation zone, IDEA has officially confirmed a structural trend continuation. However, look at the RSI indicator on the bottom panel. It has surged into extreme overbought territory (above the 80 level). While this confirms massive underlying strength, it is also a structural warning that the momentum is boiling hot and a healthy breather or retest is highly likely.
4. The Trade Plan: Entries, Targets, and Risk Management
Entry Strategy: Momentum is exceptionally strong right now near 12.97. Chasing a stock with an 80+ RSI and a massive vertical expansion candle carries a severe risk of an agonizing intraday drawdown. The highest-probability, lowest-risk entry involves stepping down to an hourly timeframe and placing limit orders to catch a potential structural pullback to perfectly retest the 12.00 to 12.45 breakout zone. Letting that old, heavy resistance prove itself as a new, indestructible support floor offers a phenomenal risk-to-reward ratio.
Take Profit (Targets): We use measured structural targets based on the depth of the macro base. By taking the depth of the Cup (roughly 4.5 points from the ~8.00 floor up to the 12.44 ceiling) and projecting it upward from the breakout line, our primary structural swing target sits comfortably in the 16.50 to 17.00 zone. Immediate psychological milestones are 14.00 and 15.00.
Invalidation (Stop Loss): A trade thesis is only valid if the new market structure holds. A hard stop loss should be placed safely below the 12.44 breakout line and the recent consolidation structure, around the 10.50 to 11.00 level. A definitive daily close completely back inside the old accumulation base and below 11.00 would act as a massive warning sign of a failed macro breakout and a severe bull trap.
5. Time Horizon:
Because this technical setup is built on a 1-Day chart capturing an explosive volume breakout and Cup completion, this is a short-to-medium-term swing trade designed to capture the violent momentum thrust. Let the new trend run!
I am taking a LONG bias on Vodafone Idea Ltd (IDEA) on the daily (1D) timeframe.
When analyzing pure market structure, the most reliable reversals occur when a stock forms a massive, rounded base. Look at the structural development on this chart. After a prior run-up, the stock suffered a deep, highly volatile markdown phase that dragged the price all the way down toward the 8.00 level. This brutal correction successfully washed out weak hands and impatient retail buyers. However, instead of collapsing further, the stock found an absolute floor and initiated a methodical, multi-month process of bottom accumulation, carving out an enormous "Cup" structure to march right back to the scene of the crime.
2. The Educational Setup: The Ceiling and the Volume
To understand the sheer strength of this current breakout, look at the mechanics of the resistance and the institutional footprints left behind:
The Accumulation Lid: For months, the stock's recovery was heavily capped by the formidable solid black resistance line at 12.44. Sellers aggressively defended this zone, creating the ultimate accumulation ceiling.
The Institutional Footprint: Look at the volume profile at the bottom of the chart. On the exact day the price pushed through the 12.44 ceiling, there was an absolute explosion in buying volume. Retail traders cannot generate that kind of volume; that is the undeniable footprint of heavy institutional capital forcing the stock into a new markup phase.
3. Current Price Action: Breakout and Boiling Indicators
Look at the most recent daily candles on the far right. The pressure cooker has absolutely exploded, pushing the price straight toward the 13.00 mark. By decisively clearing this massive accumulation zone, IDEA has officially confirmed a structural trend continuation. However, look at the RSI indicator on the bottom panel. It has surged into extreme overbought territory (above the 80 level). While this confirms massive underlying strength, it is also a structural warning that the momentum is boiling hot and a healthy breather or retest is highly likely.
4. The Trade Plan: Entries, Targets, and Risk Management
Entry Strategy: Momentum is exceptionally strong right now near 12.97. Chasing a stock with an 80+ RSI and a massive vertical expansion candle carries a severe risk of an agonizing intraday drawdown. The highest-probability, lowest-risk entry involves stepping down to an hourly timeframe and placing limit orders to catch a potential structural pullback to perfectly retest the 12.00 to 12.45 breakout zone. Letting that old, heavy resistance prove itself as a new, indestructible support floor offers a phenomenal risk-to-reward ratio.
Take Profit (Targets): We use measured structural targets based on the depth of the macro base. By taking the depth of the Cup (roughly 4.5 points from the ~8.00 floor up to the 12.44 ceiling) and projecting it upward from the breakout line, our primary structural swing target sits comfortably in the 16.50 to 17.00 zone. Immediate psychological milestones are 14.00 and 15.00.
Invalidation (Stop Loss): A trade thesis is only valid if the new market structure holds. A hard stop loss should be placed safely below the 12.44 breakout line and the recent consolidation structure, around the 10.50 to 11.00 level. A definitive daily close completely back inside the old accumulation base and below 11.00 would act as a massive warning sign of a failed macro breakout and a severe bull trap.
5. Time Horizon:
Because this technical setup is built on a 1-Day chart capturing an explosive volume breakout and Cup completion, this is a short-to-medium-term swing trade designed to capture the violent momentum thrust. Let the new trend run!
Trade active
Uptrend is in progress here. Big green candle formed today with good volume. Trade closed: target reached
It has reached the target of 15. Time to book profit. If anyone wants to still hold this stock, should have a strict trailing stop loss.
Disclaimer
The information and publications are not meant to be, and do not constitute, financial, investment, trading, or other types of advice or recommendations supplied or endorsed by TradingView. Read more in the Terms of Use.
Disclaimer
The information and publications are not meant to be, and do not constitute, financial, investment, trading, or other types of advice or recommendations supplied or endorsed by TradingView. Read more in the Terms of Use.