
International Gemological Instit (W): DUAL RESISTANCE BREAKOUT
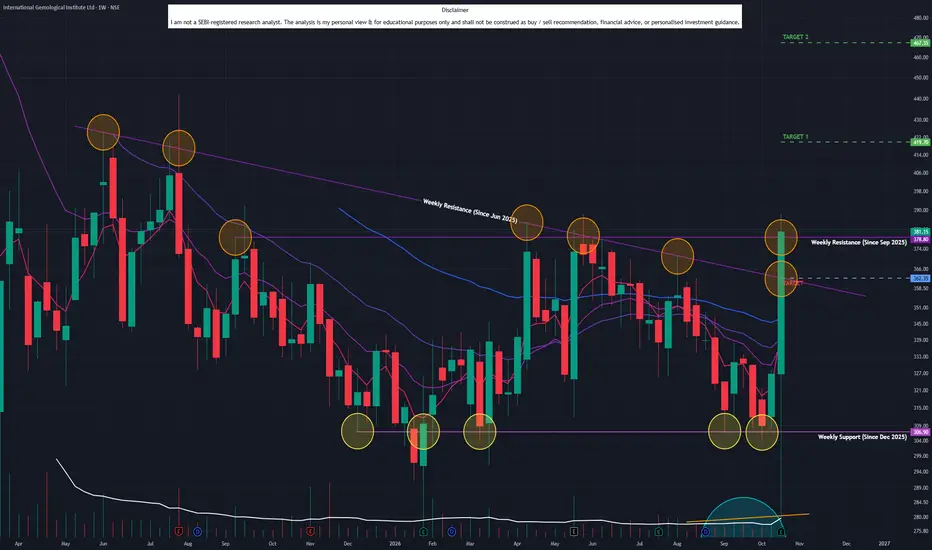
Timeframe: Weekly | Chart Scale: Logarithmic
Explosive +16.67% weekly surge backed by a huge 29.73M volume spike! 🔥
Technical Highlights:
✅ Breakout: Cleared & closed above BOTH a horizontal (Sep '25) AND angular (Jun '25) resistance!
✅ Volume: Surging volume confirms heavy buyer accumulation after weeks of failed breakout attempts.
✅ Momentum: Daily EMAs in positive crossover (Weekly soon). MACD & RSI rising. 🚀
Key Levels to Watch:
🎯 Target 1: 420
🎯 Target 2: 467
🛡️ Support / Pullback: 362.35 (Previous resistance turned support)
Keep a close eye on price action over the coming days to see if the stock can sustain this high-volume trajectory! 📈
Are you tracking setups across Commercial Services sector? Share your perspective below! 👇
Explosive +16.67% weekly surge backed by a huge 29.73M volume spike! 🔥
Technical Highlights:
✅ Breakout: Cleared & closed above BOTH a horizontal (Sep '25) AND angular (Jun '25) resistance!
✅ Volume: Surging volume confirms heavy buyer accumulation after weeks of failed breakout attempts.
✅ Momentum: Daily EMAs in positive crossover (Weekly soon). MACD & RSI rising. 🚀
Key Levels to Watch:
🎯 Target 1: 420
🎯 Target 2: 467
🛡️ Support / Pullback: 362.35 (Previous resistance turned support)
Keep a close eye on price action over the coming days to see if the stock can sustain this high-volume trajectory! 📈
Are you tracking setups across Commercial Services sector? Share your perspective below! 👇

Disclaimer
The information and publications are not meant to be, and do not constitute, financial, investment, trading, or other types of advice or recommendations supplied or endorsed by TradingView. Read more in the Terms of Use.
Disclaimer
The information and publications are not meant to be, and do not constitute, financial, investment, trading, or other types of advice or recommendations supplied or endorsed by TradingView. Read more in the Terms of Use.