
This post is educational and observational in nature based on historical price action. It is not a forecast or a trading recommendation.
The Reverse Fibonacci Approach
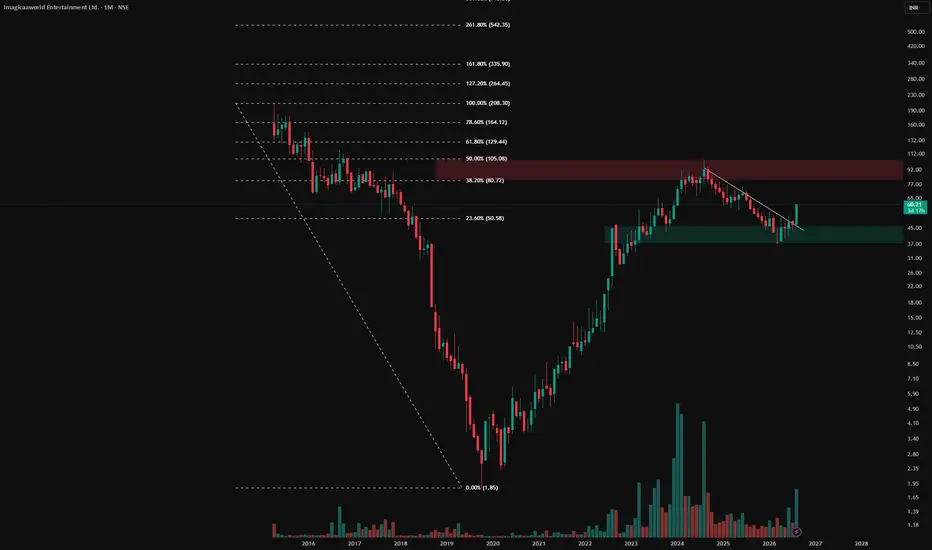
In a typical Fibonacci retracement, the swing low is anchored as the zero point and the swing high as the one point, measuring a retracement within an upward move. In this chart, that logic has been reversed. Since this stock is in a downtrend, the swing high has been anchored as the zero point and the swing low as the one point, creating what can be called a reverse Fibonacci. This reframes the retracement zones to reflect a corrective bounce within a broader downward structure rather than a pullback within an uptrend.
The 38.2% to 50% Zone
Within this reversed framework, the 38.2% to 50% zone has been marked on the chart. Even measured this way, this area remains within what is generally considered bearish territory for the overall structure, since the broader trend has not shown a decisive reversal beyond this zone.
The Supply Conversion
Marked in green is a zone that tells its own story. During 2022 and 2023, price recovered into this area, and what had previously acted as a solid resistance zone showed signs of conversion, with the market beginning to treat it differently on subsequent visits. This shift is worth observing closely, since a resistance area evolving in this way often reflects a change in how buyers and sellers are interacting at that level.
The Reverse Fibonacci Approach
In a typical Fibonacci retracement, the swing low is anchored as the zero point and the swing high as the one point, measuring a retracement within an upward move. In this chart, that logic has been reversed. Since this stock is in a downtrend, the swing high has been anchored as the zero point and the swing low as the one point, creating what can be called a reverse Fibonacci. This reframes the retracement zones to reflect a corrective bounce within a broader downward structure rather than a pullback within an uptrend.
The 38.2% to 50% Zone
Within this reversed framework, the 38.2% to 50% zone has been marked on the chart. Even measured this way, this area remains within what is generally considered bearish territory for the overall structure, since the broader trend has not shown a decisive reversal beyond this zone.
The Supply Conversion
Marked in green is a zone that tells its own story. During 2022 and 2023, price recovered into this area, and what had previously acted as a solid resistance zone showed signs of conversion, with the market beginning to treat it differently on subsequent visits. This shift is worth observing closely, since a resistance area evolving in this way often reflects a change in how buyers and sellers are interacting at that level.

📊Swing & positional research with Buy, Sell & Hold recommendations
Contact for NOVEMBER SLOTS
📞WhatsApp ( Pro ): wa.me/919455664601
📢Free Picks on Telegram ( Join ) : t.me/hashtaghammer
Apoorv Dubey|SEBI RA INH000030287
Contact for NOVEMBER SLOTS
📞WhatsApp ( Pro ): wa.me/919455664601
📢Free Picks on Telegram ( Join ) : t.me/hashtaghammer
Apoorv Dubey|SEBI RA INH000030287
Related publications
Disclaimer
The information and publications are not meant to be, and do not constitute, financial, investment, trading, or other types of advice or recommendations supplied or endorsed by TradingView. Read more in the Terms of Use.
📊Swing & positional research with Buy, Sell & Hold recommendations
Contact for NOVEMBER SLOTS
📞WhatsApp ( Pro ): wa.me/919455664601
📢Free Picks on Telegram ( Join ) : t.me/hashtaghammer
Apoorv Dubey|SEBI RA INH000030287
Contact for NOVEMBER SLOTS
📞WhatsApp ( Pro ): wa.me/919455664601
📢Free Picks on Telegram ( Join ) : t.me/hashtaghammer
Apoorv Dubey|SEBI RA INH000030287
Related publications
Disclaimer
The information and publications are not meant to be, and do not constitute, financial, investment, trading, or other types of advice or recommendations supplied or endorsed by TradingView. Read more in the Terms of Use.