
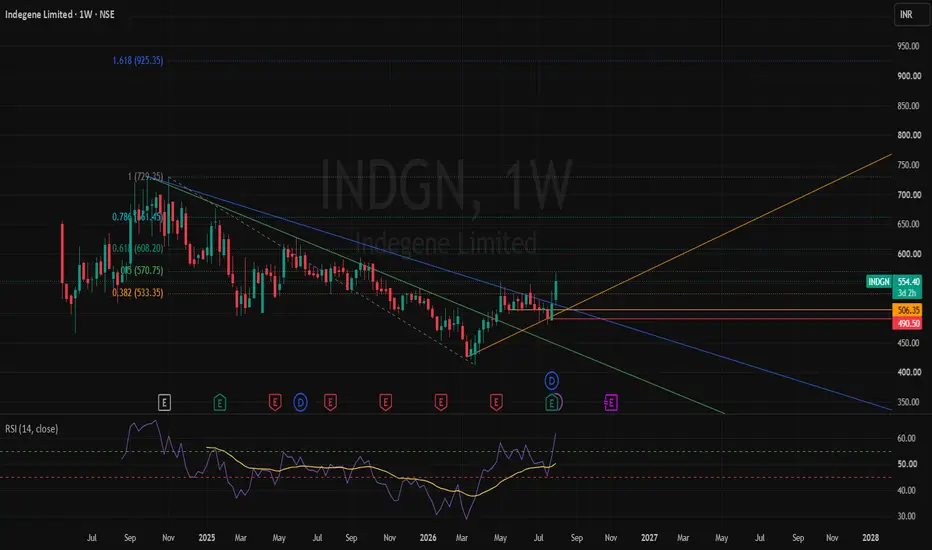
INDGN is showing an interesting weekly recovery setup after spending many months inside a falling structure.
The chart had been under pressure for a long time, but recent price action suggests that weakness may be slowing and a base formation / recovery attempt may be developing. The stock has pushed up from lower levels and is now testing an important resistance cluster.
My view:
The immediate recovery structure remains constructive as long as price holds above the ₹506–490 zone.
The first meaningful hurdle is around ₹570–575.
If the stock manages to sustain above ₹570–575 on the weekly chart, the next important zone opens near ₹605–620.
A stronger move above ₹620 can improve the larger structure further and may shift the chart from a simple bounce to a more credible medium-term recovery phase.
Downside view:
The near support zone is ₹506–490.
If this area fails, then ₹474–459 becomes the broader support region to track.
A breakdown below those lower support levels would weaken the current recovery attempt and delay the larger turnaround structure.
Conclusion:
For now, I see INDGN as a recovery setup under observation, not a confirmed big breakout yet.
The chart is clearly improving, but the real confirmation comes only if price sustains above the next resistance band.
So at this stage, it looks like a “watch closely” setup where the next few weekly closes can become important.
Shared only for educational study and chart-tracking purpose. This is not a buy/sell recommendation or investment advice. I am not a SEBI-registered advisor. Please do your own research or consult a qualified financial advisor before taking any investment decision.
#INDGN #Indegene #NSE #WeeklyChart #BreakoutWatch #TrendAnalysis #SupportAndResistance #ChartStudy #IndianStocks #HealthcareStocks
The chart had been under pressure for a long time, but recent price action suggests that weakness may be slowing and a base formation / recovery attempt may be developing. The stock has pushed up from lower levels and is now testing an important resistance cluster.
My view:
The immediate recovery structure remains constructive as long as price holds above the ₹506–490 zone.
The first meaningful hurdle is around ₹570–575.
If the stock manages to sustain above ₹570–575 on the weekly chart, the next important zone opens near ₹605–620.
A stronger move above ₹620 can improve the larger structure further and may shift the chart from a simple bounce to a more credible medium-term recovery phase.
Downside view:
The near support zone is ₹506–490.
If this area fails, then ₹474–459 becomes the broader support region to track.
A breakdown below those lower support levels would weaken the current recovery attempt and delay the larger turnaround structure.
Conclusion:
For now, I see INDGN as a recovery setup under observation, not a confirmed big breakout yet.
The chart is clearly improving, but the real confirmation comes only if price sustains above the next resistance band.
So at this stage, it looks like a “watch closely” setup where the next few weekly closes can become important.
Shared only for educational study and chart-tracking purpose. This is not a buy/sell recommendation or investment advice. I am not a SEBI-registered advisor. Please do your own research or consult a qualified financial advisor before taking any investment decision.
#INDGN #Indegene #NSE #WeeklyChart #BreakoutWatch #TrendAnalysis #SupportAndResistance #ChartStudy #IndianStocks #HealthcareStocks

Disclaimer
The information and publications are not meant to be, and do not constitute, financial, investment, trading, or other types of advice or recommendations supplied or endorsed by TradingView. Read more in the Terms of Use.
Disclaimer
The information and publications are not meant to be, and do not constitute, financial, investment, trading, or other types of advice or recommendations supplied or endorsed by TradingView. Read more in the Terms of Use.