
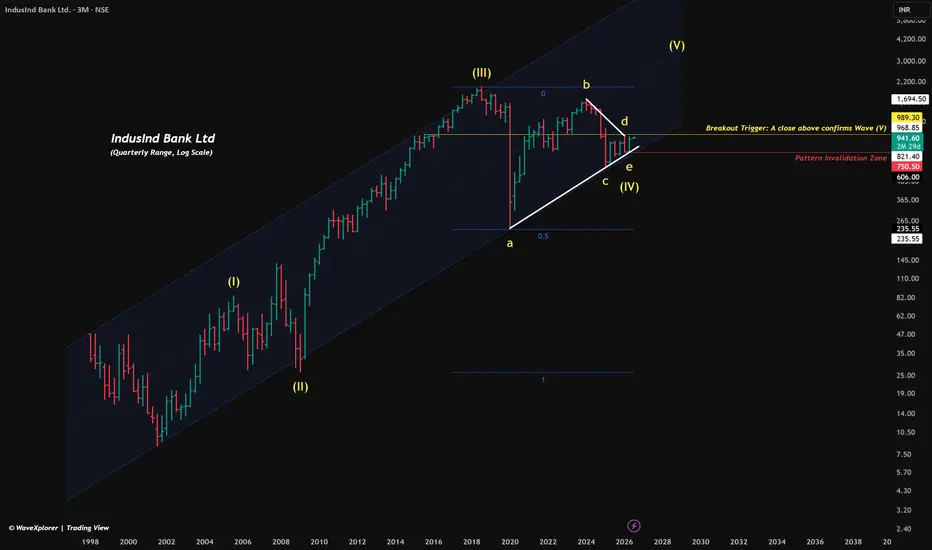
Looking at the multi-decade chart of IndusInd Bank, we are witnessing a massive financial story unfold. The stock has respected the same geometric boundaries for nearly 30 years, and it is now approaching a major decision point.
Here is a simple breakdown of the macro picture:
1. The 28-Year Parallel Channel
Since its inception in the late 1990s, the stock has traded inside a giant ascending parallel channel.
2. The 6-Year Rest Phase (Wave IV)
After hitting an all-time high of ₹2,038 in 2018, the stock entered a long, exhausting correction. On an Elliott Wave basis, this looks like a classic abcde contracting triangle:
By holding this level, the stock proved that buyers are still defending the long-term trend.
The Current Setup: The Squeeze
Right now, the stock is trading at ₹941.60, sitting right at the apex of this 6-year triangle.
The Trade Plan
Disclaimer: This post is for educational purposes only and is not financial advice. I am not a SEBI-registered analyst. Please do your own research and manage your risk carefully.
Here is a simple breakdown of the macro picture:
1. The 28-Year Parallel Channel
Since its inception in the late 1990s, the stock has traded inside a giant ascending parallel channel.
- The bottom line has always acted as a rock-solid floor.
- The top line acts as the ultimate ceiling.
2. The 6-Year Rest Phase (Wave IV)
After hitting an all-time high of ₹2,038 in 2018, the stock entered a long, exhausting correction. On an Elliott Wave basis, this looks like a classic abcde contracting triangle:
- Point a: The March 2020 COVID crash floor at ₹235.55. Interestingly, Point a bottomed out exactly at the 0.5 log retracement of the entire Wave (III) rise, showing how perfectly the market respected this geometry.
- Point e (The Final Floor): The recent correction held the structural support line around ₹750.50.
By holding this level, the stock proved that buyers are still defending the long-term trend.
The Current Setup: The Squeeze
Right now, the stock is trading at ₹941.60, sitting right at the apex of this 6-year triangle.
- The Trigger: It is currently testing the white descending resistance line connecting points b and d.
- The Breakout: A strong, decisive close above this trendline will signal that the 6-year correction is officially over.
The Trade Plan
- The Bullish Target (Wave V): If the breakout is confirmed, it opens the door for a brand-new, multi-year bull market. The ultimate goal for Wave (V) would be to reclaim the old highs of ₹2,038 and trend toward the upper half of the multi-decade channel.
- The Risk (Invalidation): The entire bullish setup relies on the recent floor holding. If the price breaks below ₹750, the triangle pattern fails, and the view must be revised.
Disclaimer: This post is for educational purposes only and is not financial advice. I am not a SEBI-registered analyst. Please do your own research and manage your risk carefully.

WaveXplorer | Elliott Wave insights
📊 X profile: @veerappa89
📊 X profile: @veerappa89
Disclaimer
The information and publications are not meant to be, and do not constitute, financial, investment, trading, or other types of advice or recommendations supplied or endorsed by TradingView. Read more in the Terms of Use.
WaveXplorer | Elliott Wave insights
📊 X profile: @veerappa89
📊 X profile: @veerappa89
Disclaimer
The information and publications are not meant to be, and do not constitute, financial, investment, trading, or other types of advice or recommendations supplied or endorsed by TradingView. Read more in the Terms of Use.