
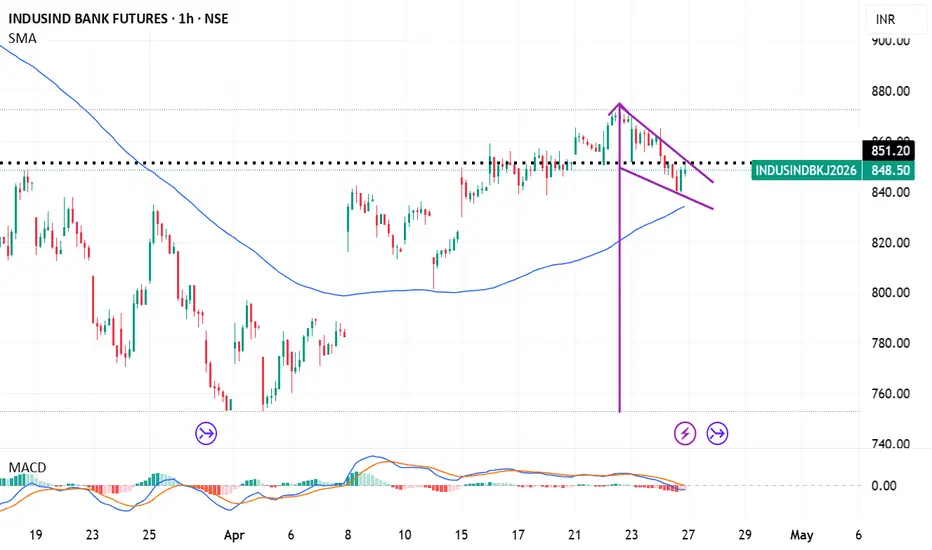
Based on technical analysis of the hourly chart, here is the breakdown of the potential pole and flag setup for IndusInd Bank (INDUSINDBK) around April 24, 2026.
Pattern: Bullish Pole and Flag (Continuation Pattern)
Entry Strategy: Wait for a clear breakout above the flag resistance (around ₹865-870) on high volume on the hourly chart.
Stop Loss (SL): ₹825 (Tight SL) or below ₹820 (Ideal).
Target (T1): ₹900 (Immediate Resistance).
Target (T2): ₹920+ (Target based on flagpole height projection)
Trade closed: target reached

Disclaimer
The information and publications are not meant to be, and do not constitute, financial, investment, trading, or other types of advice or recommendations supplied or endorsed by TradingView. Read more in the Terms of Use.
Disclaimer
The information and publications are not meant to be, and do not constitute, financial, investment, trading, or other types of advice or recommendations supplied or endorsed by TradingView. Read more in the Terms of Use.