
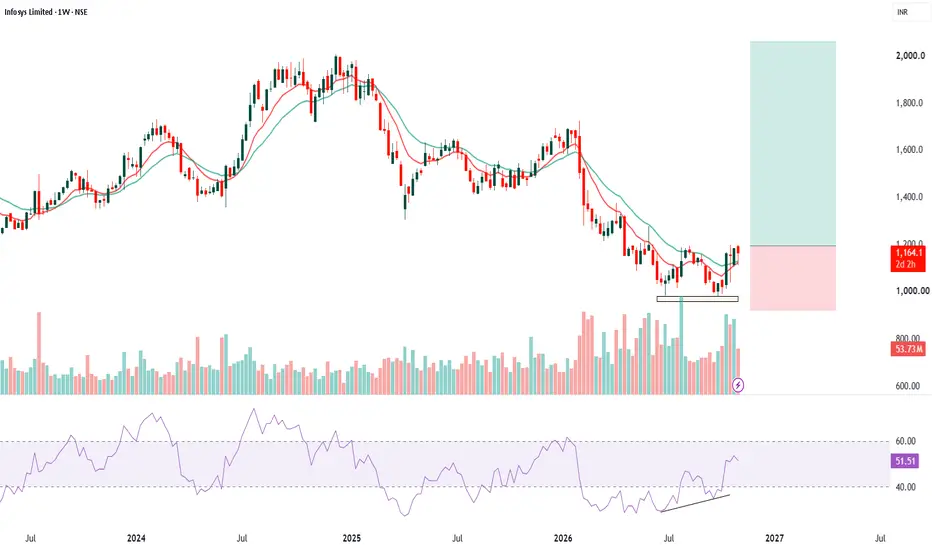
Infosys Ltd. is showing signs of a potential trend reversal on the weekly chart after a prolonged correction. The stock has formed a double-bottom structure around the ₹950–980 zone, indicating buying interest at lower levels and the possibility of accumulation. The recent recovery above the 10 and 20 EMAs suggests improving price momentum and an early shift in the weekly trend. Volume expansion during the recent upward move adds strength to this recovery, indicating renewed participation from buyers. The RSI has recovered to 51.55, moving above the 40 level and entering positive territory. More importantly, RSI is showing positive bullish divergence, where price retested its support zone while RSI formed higher lows, suggesting weakening selling pressure. A sustained move above RSI 60 would provide stronger confirmation of bullish momentum.
Trade levels (Weekly Chart):
- Entry: ₹1,163–1,170
- Stop Loss: ₹910
- Target 1: ₹1,500
- Target 2: ₹1,650
- Target 3: ₹1,908
Important: The stop loss must be considered on a weekly closing basis, not on an intraday price movement.
Trade levels (Weekly Chart):
- Entry: ₹1,163–1,170
- Stop Loss: ₹910
- Target 1: ₹1,500
- Target 2: ₹1,650
- Target 3: ₹1,908
Important: The stop loss must be considered on a weekly closing basis, not on an intraday price movement.

Disclaimer
The information and publications are not meant to be, and do not constitute, financial, investment, trading, or other types of advice or recommendations supplied or endorsed by TradingView. Read more in the Terms of Use.
Disclaimer
The information and publications are not meant to be, and do not constitute, financial, investment, trading, or other types of advice or recommendations supplied or endorsed by TradingView. Read more in the Terms of Use.