
Overview
Indian Oil Corporation is holding right at a confluence of technical support on the weekly chart, while also trading at valuations that stand out favorably against its refining peers. This is a good example of technical and fundamental pictures lining up — worth examining both together.
Technical Structure
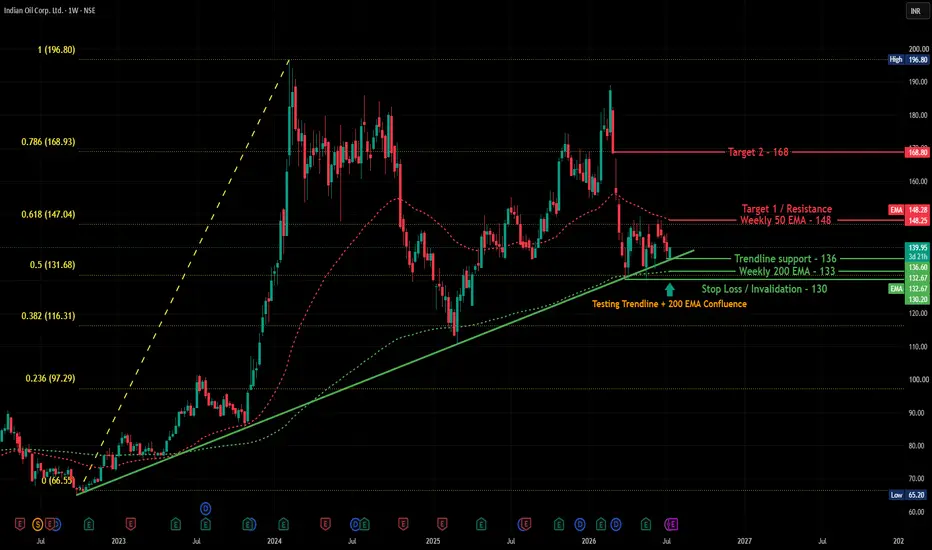
On the weekly chart, IOC is trading at 139.95 (+0.71%), sitting right on a rising trendline support (~136) that has held since the 2022 lows, with the Weekly 200 EMA (132.67) just below it, adding confluence. The Weekly 50 EMA (148.25) sits just above as the immediate resistance to watch. Price also remains inside the broader retracement structure from the 2022 low (65.20) to the 2024 high (196.80), currently hovering near the 0.5 Fibonacci level (131.68).
Trade Setup
Entry: Above 140–142 on a sustained move, using the trendline/200 EMA confluence as the base
Stop Loss (Invalidation): Below 130 (just under the Weekly 200 EMA/trendline confluence zone)
Target 1: 148 (Weekly 50 EMA)
Target 2: 168.80 (0.786 Fibonacci level)
Fundamentals — Why This Matters for Long-Term Investors
Valuation: Trading at a P/E of 4.69, well below peers like Reliance (22.52) and MRPL (15.01) — among the cheapest in the sector
Dividend: Strong dividend yield of 5.00%, with a healthy long-term payout history
Profitability: ROE of 20.74% and ROCE of 18.78%, notably ahead of Reliance (ROE 8.91%) and competitive with BPCL/HPCL
Debt: Carries meaningful debt (₹131,822 Cr), typical for capital-intensive PSU refiners but worth noting relative to peers like CPCL, which run lower debt levels
Earnings trend: FY26 net profit of ₹43,677 Cr marks a sharp recovery from FY25's ₹13,789 Cr, though the multi-year picture is volatile, reflecting sensitivity to crude prices and government fuel pricing policy
Caveat: 10-year compounded sales growth is modest, and earnings volatility here is real — this isn't a smooth-growth story, more a cyclical value-and-yield profile
Beginner's Lesson
When a stock's technical support level aligns with an attractive valuation (like a low P/E relative to peers), it can add conviction to a setup — the chart shows where buyers have historically stepped in, while the fundamentals help explain why. That said, PSU oil marketing companies are heavily influenced by government fuel pricing policy and crude oil price cycles, which can override both charts and valuation in the short term — worth keeping in mind before treating this as a purely technical or purely fundamental call.
Conclusion
IOC presents a case where technical support and reasonable valuation are lining up together. As always, confirm with price action before acting on the technical setup, and consider your own investment horizon and risk tolerance if evaluating this from a fundamentals perspective.
Fundamental data sourced from Screener.in. Not investment advice. For educational purposes only. Please consult your financial advisor before making any investment or trading decisions.
Indian Oil Corporation is holding right at a confluence of technical support on the weekly chart, while also trading at valuations that stand out favorably against its refining peers. This is a good example of technical and fundamental pictures lining up — worth examining both together.
Technical Structure
On the weekly chart, IOC is trading at 139.95 (+0.71%), sitting right on a rising trendline support (~136) that has held since the 2022 lows, with the Weekly 200 EMA (132.67) just below it, adding confluence. The Weekly 50 EMA (148.25) sits just above as the immediate resistance to watch. Price also remains inside the broader retracement structure from the 2022 low (65.20) to the 2024 high (196.80), currently hovering near the 0.5 Fibonacci level (131.68).
Trade Setup
Entry: Above 140–142 on a sustained move, using the trendline/200 EMA confluence as the base
Stop Loss (Invalidation): Below 130 (just under the Weekly 200 EMA/trendline confluence zone)
Target 1: 148 (Weekly 50 EMA)
Target 2: 168.80 (0.786 Fibonacci level)
Fundamentals — Why This Matters for Long-Term Investors
Valuation: Trading at a P/E of 4.69, well below peers like Reliance (22.52) and MRPL (15.01) — among the cheapest in the sector
Dividend: Strong dividend yield of 5.00%, with a healthy long-term payout history
Profitability: ROE of 20.74% and ROCE of 18.78%, notably ahead of Reliance (ROE 8.91%) and competitive with BPCL/HPCL
Debt: Carries meaningful debt (₹131,822 Cr), typical for capital-intensive PSU refiners but worth noting relative to peers like CPCL, which run lower debt levels
Earnings trend: FY26 net profit of ₹43,677 Cr marks a sharp recovery from FY25's ₹13,789 Cr, though the multi-year picture is volatile, reflecting sensitivity to crude prices and government fuel pricing policy
Caveat: 10-year compounded sales growth is modest, and earnings volatility here is real — this isn't a smooth-growth story, more a cyclical value-and-yield profile
Beginner's Lesson
When a stock's technical support level aligns with an attractive valuation (like a low P/E relative to peers), it can add conviction to a setup — the chart shows where buyers have historically stepped in, while the fundamentals help explain why. That said, PSU oil marketing companies are heavily influenced by government fuel pricing policy and crude oil price cycles, which can override both charts and valuation in the short term — worth keeping in mind before treating this as a purely technical or purely fundamental call.
Conclusion
IOC presents a case where technical support and reasonable valuation are lining up together. As always, confirm with price action before acting on the technical setup, and consider your own investment horizon and risk tolerance if evaluating this from a fundamentals perspective.
Fundamental data sourced from Screener.in. Not investment advice. For educational purposes only. Please consult your financial advisor before making any investment or trading decisions.

📈 HK Trading Community | Market Structure & Indicator Updates
Telegram: t.me/trendstrike1000
Website: quantumedgepro.netlify.app/
Real traders are built through learning,not tip hunting.So Start Learning How the Market Really Works
Telegram: t.me/trendstrike1000
Website: quantumedgepro.netlify.app/
Real traders are built through learning,not tip hunting.So Start Learning How the Market Really Works
Disclaimer
The information and publications are not meant to be, and do not constitute, financial, investment, trading, or other types of advice or recommendations supplied or endorsed by TradingView. Read more in the Terms of Use.
📈 HK Trading Community | Market Structure & Indicator Updates
Telegram: t.me/trendstrike1000
Website: quantumedgepro.netlify.app/
Real traders are built through learning,not tip hunting.So Start Learning How the Market Really Works
Telegram: t.me/trendstrike1000
Website: quantumedgepro.netlify.app/
Real traders are built through learning,not tip hunting.So Start Learning How the Market Really Works
Disclaimer
The information and publications are not meant to be, and do not constitute, financial, investment, trading, or other types of advice or recommendations supplied or endorsed by TradingView. Read more in the Terms of Use.