
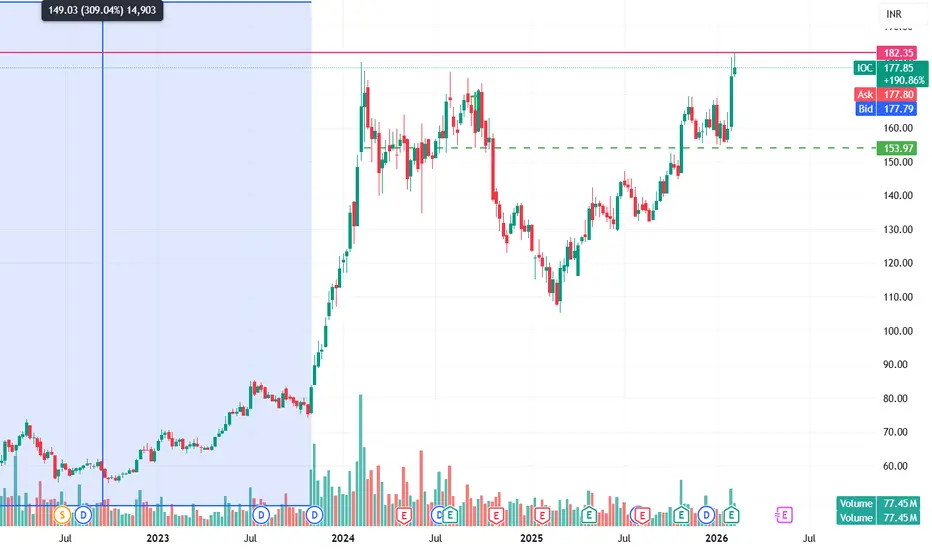
IOC is not setting up for a routine breakout. The stock is attempting to emerge from a massive 7–8 year consolidation phase, making this a potential multi-year structural breakout rather than a short-term move.
Since 2017, IOC has repeatedly faced selling pressure near the 180–190 resistance zone, keeping the stock range-bound for years. Now, price is back at this critical level — but this time with strong trend structure and visible volume expansion, suggesting a clear shift in market behavior.
The overall price action shows a transition from range mode to trend mode. Higher highs and higher lows are already in place, and pullbacks are becoming shallow — a classic sign of institutional accumulation. Price is also trading comfortably above its key moving averages, reinforcing the long-term bullish bias.
Momentum indicators support the setup as well. The Vortex Indicator shows clear buyer dominance, indicating that sellers are gradually losing control. Currently, the stock is consolidating in a tight 177–182 zone, which looks more like energy build-up than exhaustion.
A sustained move above the 185–190 zone, especially on a monthly closing basis, could confirm a major structural breakout and open the door for a strong trend continuation.
Key Levels to Watch
🚀 Breakout Zone: 185 – 192 (Sustaining above this is crucial)
🛡️ Immediate Support: 165
🛡️ Structural Support: 153
Final Take
IOC is standing at the edge of a long-term trend shift. Multi-year bases take time to resolve, but once the breakout is confirmed, the resulting move is often powerful and decisive. This setup is more about confirmation and patience than prediction.
Big bases don’t deliver fast moves — they deliver big moves.
— Ayushi Shrivastava
Independent Market Research | Technical & Structural Analysis
This research is my own work, supported by AI tools for data structuring and visualization.
Disclaimer: This analysis is for educational purposes only. Not investment advice.
Since 2017, IOC has repeatedly faced selling pressure near the 180–190 resistance zone, keeping the stock range-bound for years. Now, price is back at this critical level — but this time with strong trend structure and visible volume expansion, suggesting a clear shift in market behavior.
The overall price action shows a transition from range mode to trend mode. Higher highs and higher lows are already in place, and pullbacks are becoming shallow — a classic sign of institutional accumulation. Price is also trading comfortably above its key moving averages, reinforcing the long-term bullish bias.
Momentum indicators support the setup as well. The Vortex Indicator shows clear buyer dominance, indicating that sellers are gradually losing control. Currently, the stock is consolidating in a tight 177–182 zone, which looks more like energy build-up than exhaustion.
A sustained move above the 185–190 zone, especially on a monthly closing basis, could confirm a major structural breakout and open the door for a strong trend continuation.
Key Levels to Watch
🚀 Breakout Zone: 185 – 192 (Sustaining above this is crucial)
🛡️ Immediate Support: 165
🛡️ Structural Support: 153
Final Take
IOC is standing at the edge of a long-term trend shift. Multi-year bases take time to resolve, but once the breakout is confirmed, the resulting move is often powerful and decisive. This setup is more about confirmation and patience than prediction.
Big bases don’t deliver fast moves — they deliver big moves.
— Ayushi Shrivastava
Independent Market Research | Technical & Structural Analysis
This research is my own work, supported by AI tools for data structuring and visualization.
Disclaimer: This analysis is for educational purposes only. Not investment advice.

Disclaimer
The information and publications are not meant to be, and do not constitute, financial, investment, trading, or other types of advice or recommendations supplied or endorsed by TradingView. Read more in the Terms of Use.
Disclaimer
The information and publications are not meant to be, and do not constitute, financial, investment, trading, or other types of advice or recommendations supplied or endorsed by TradingView. Read more in the Terms of Use.