
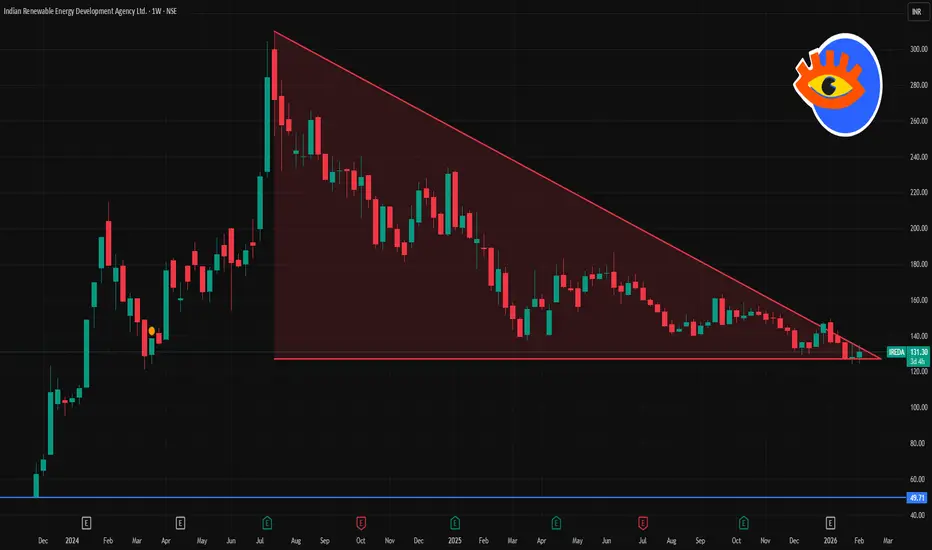
📌 Current Price Snapshot
👉 Latest available price data shows IREDA trading around ~₹130–₹135 on the NSE (end of January 2026) — this serves as the baseline for weekly levels.
📈 Weekly Technical Levels (Key Zones)
🚧 Weekly Resistance Levels (Upside)
Level Significance
₹136–₹138 Near‑term resistance — first obstacle for bulls this week.
₹138–₹140 Secondary resistance — key short‑term range top.
₹145–₹150 Major weekly resistance zone — breakout above this signals strength.
🛑 Weekly Support Levels (Downside)
Level Significance
₹130–₹131 Immediate weekly support area — crucial for holding near current price.
₹126–₹127 Secondary support — next cushion if price slips.
₹122–₹123 Strong support zone below — potential downside limit this week.
📉 Weekly Outlook Structure
Bullish Scenario
✅ If price closes above ~₹138–₹140 on the weekly chart → next upside target becomes ₹145–₹150. Continued strength above ₹150 would target even higher levels.
Bearish Scenario
❌ A weekly close below ~₹130–₹127 → opens the door to deeper support at ₹122–₹123.
📊 Momentum & Indicators
RSI near lower area suggests mild bearish momentum (not oversold yet).
The stock remains below key medium/long‑term EMAs, indicating ongoing downward bias unless a strong breakout occurs.
📌 Summary – Weekly Levels to Watch
Bullish Break Points
🔹 First Resist: ₹136–₹138
🔹 Next Resist: ₹138–₹140
🔹 Major Resist: ₹145–₹150
Bearish Support Points
🔸 First Support: ₹130–₹131
🔸 Next Support: ₹126–₹127
🔸 Strong Support: ₹122–₹123

Contact Knowledgehub for a detailed consultation: Dm on WhatsApp: [wa.link/a2o0kz]-
Phone No: [+91 93102 26243]-
Email: [tradingviewknowledgehub@gmail.com]---
-- Let’s achieve success together!
Phone No: [+91 93102 26243]-
Email: [tradingviewknowledgehub@gmail.com]---
-- Let’s achieve success together!
Related publications
Disclaimer
The information and publications are not meant to be, and do not constitute, financial, investment, trading, or other types of advice or recommendations supplied or endorsed by TradingView. Read more in the Terms of Use.