
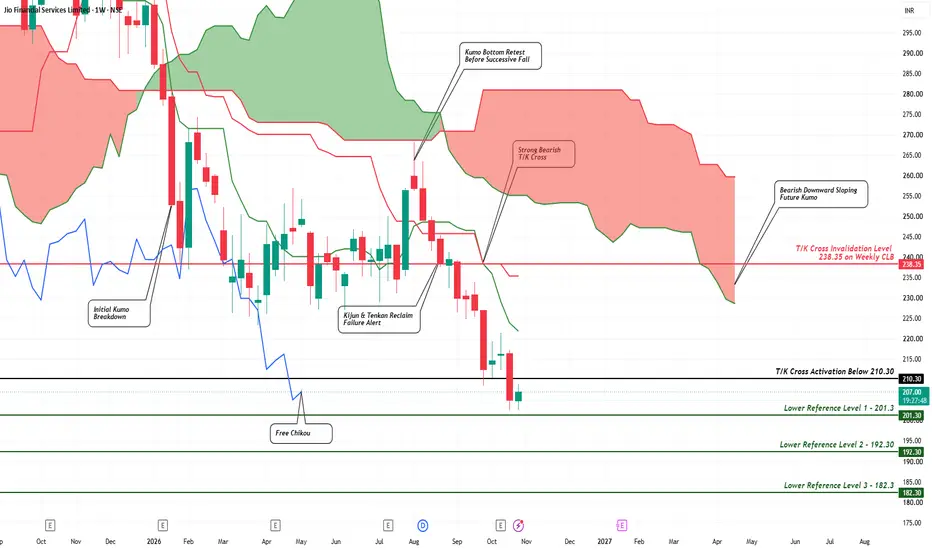
JIOFIN’s weekly chart is clearly depicting a progressive bearish breakdown structure.
• Initial Kumo breakdown → throwback to retest the Kumo bottom → rejection.
• Kijun & Tenkan reclaim failure followed by a strong bearish T/K cross below the Kumo -> Further deterioration in the chart structure.
• The bearish T/K cross stands activated below 210.30. Invalidation sits at 238.35, requiring a strong weekly close above it with follow-through.
• Additional bearish confirmations: the Future Kumo remains bearish and downward sloping, while the Chikou Span is free — both supporting the ongoing bearish structure.
The stock has a limited price history of just ~3 years, with an All-Time Low (ATL) of 198.65.
With price now approaching its historical low, the marked lower reference levels at 192.30 and 182.30 extend below the ATL.
If the bearish structure continues to play out, could JIOFIN be heading into genuinely uncharted price territory?
A setup worth watching closely

Disclaimer
The information and publications are not meant to be, and do not constitute, financial, investment, trading, or other types of advice or recommendations supplied or endorsed by TradingView. Read more in the Terms of Use.
Disclaimer
The information and publications are not meant to be, and do not constitute, financial, investment, trading, or other types of advice or recommendations supplied or endorsed by TradingView. Read more in the Terms of Use.