
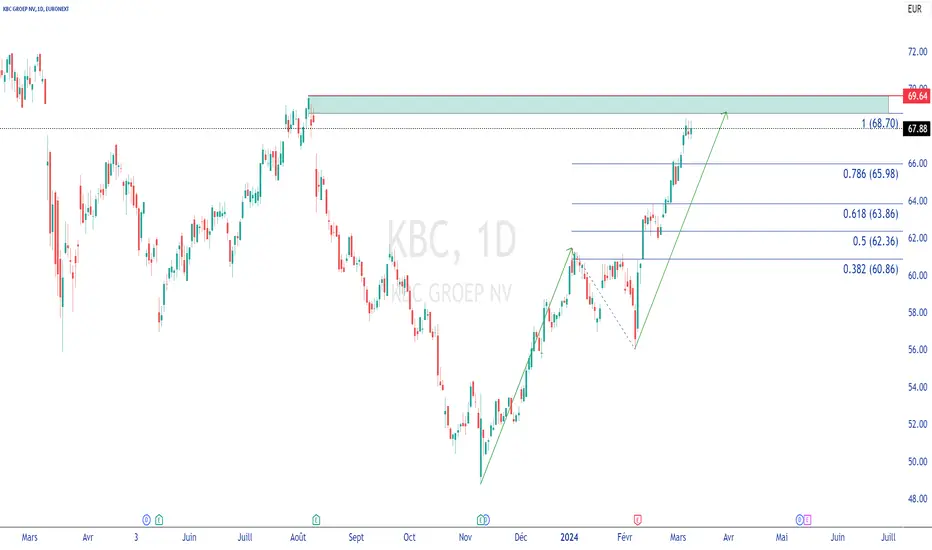
Graphique en journalier avec Fibonacci.
On va droit vers un AB = CD.
La magie de l'analyse technique !
Cible à atteindre le carré vert sur le graphique, attention il est peut-être temps de prendre les profits !
Faite votre opinion.
On va droit vers un AB = CD.
La magie de l'analyse technique !
Cible à atteindre le carré vert sur le graphique, attention il est peut-être temps de prendre les profits !
Faite votre opinion.

Disclaimer
The information and publications are not meant to be, and do not constitute, financial, investment, trading, or other types of advice or recommendations supplied or endorsed by TradingView. Read more in the Terms of Use.
Disclaimer
The information and publications are not meant to be, and do not constitute, financial, investment, trading, or other types of advice or recommendations supplied or endorsed by TradingView. Read more in the Terms of Use.