
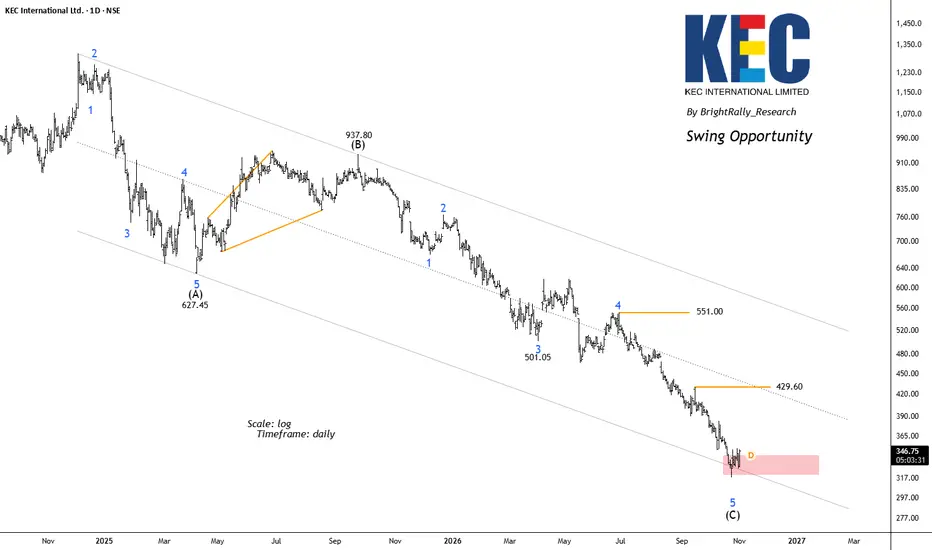
KEC International has been trading inside a broad descending channel, reflecting a prolonged corrective phase. The Elliott Wave structure suggests that the stock may be approaching the final stages of a larger Wave (C) decline.
The chart shows Wave (A) ending near ₹627.45, followed by a recovery into Wave (B) near ₹937.80. Since then, the stock has continued its downward journey in a developing Wave (C) structure.
The recent decline appears to be completing Wave 5, with the price now entering an important demand zone around ₹317.25. The latest daily candle has shown a positive move, which could indicate early buying interest.
Key levels to watch
- Immediate support: ₹317
- First resistance: ₹429.60
- Major resistance: ₹551
Swing outlook
KEC is approaching a technically important area where a relief rally or swing recovery could develop. A sustained move above ₹429.60 would strengthen the recovery scenario and bring ₹551 into focus.
However, the broader trend remains bearish, so a positive candle alone is not enough to confirm a reversal. A decisive break below ₹317.25 would weaken the bullish setup and suggest that the correction may continue.
BrightRally_Research on TradingView
The chart shows Wave (A) ending near ₹627.45, followed by a recovery into Wave (B) near ₹937.80. Since then, the stock has continued its downward journey in a developing Wave (C) structure.
The recent decline appears to be completing Wave 5, with the price now entering an important demand zone around ₹317.25. The latest daily candle has shown a positive move, which could indicate early buying interest.
Key levels to watch
- Immediate support: ₹317
- First resistance: ₹429.60
- Major resistance: ₹551
Swing outlook
KEC is approaching a technically important area where a relief rally or swing recovery could develop. A sustained move above ₹429.60 would strengthen the recovery scenario and bring ₹551 into focus.
However, the broader trend remains bearish, so a positive candle alone is not enough to confirm a reversal. A decisive break below ₹317.25 would weaken the bullish setup and suggest that the correction may continue.
BrightRally_Research on TradingView
Trade active
Will update the chart when the reversal is taking place. Stay tuned!
Related publications
Disclaimer
The information and publications are not meant to be, and do not constitute, financial, investment, trading, or other types of advice or recommendations supplied or endorsed by TradingView. Read more in the Terms of Use.
Related publications
Disclaimer
The information and publications are not meant to be, and do not constitute, financial, investment, trading, or other types of advice or recommendations supplied or endorsed by TradingView. Read more in the Terms of Use.