
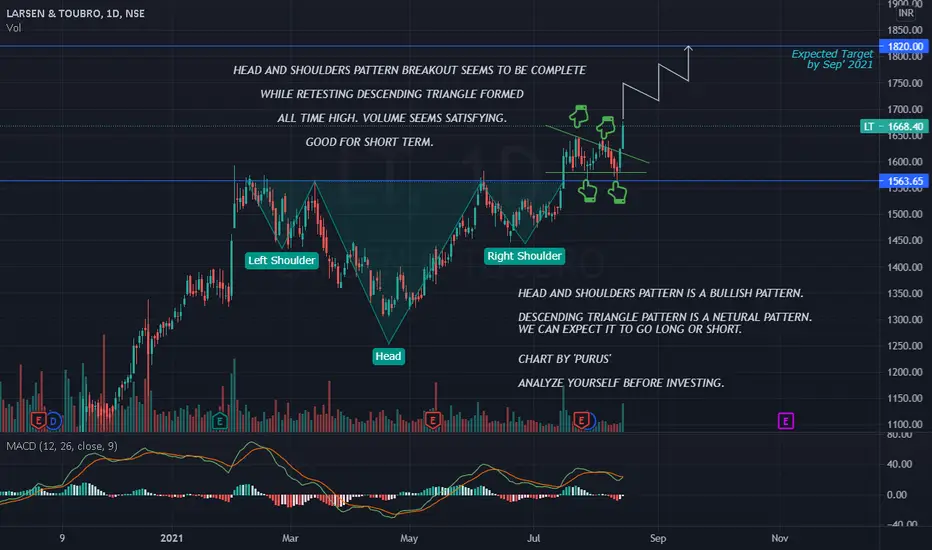
L & T Stock is just completed Head and Shoulders Pattern which is a bullish pattern, retesting also completed and formed Descending triangle pattern with breakout. So, we can expect the stock may go long.
Good buy for short term.
Please check the chart for details. Mentioned clearly about the support and resistance points (if applicable).
I am learning as well. so please analyse the chart by yourselves before taking any decisions.
Criticism always welcome
Good buy for short term.
Please check the chart for details. Mentioned clearly about the support and resistance points (if applicable).
I am learning as well. so please analyse the chart by yourselves before taking any decisions.
Criticism always welcome
Trade active
Retest is on progress.
Disclaimer
The information and publications are not meant to be, and do not constitute, financial, investment, trading, or other types of advice or recommendations supplied or endorsed by TradingView. Read more in the Terms of Use.
Disclaimer
The information and publications are not meant to be, and do not constitute, financial, investment, trading, or other types of advice or recommendations supplied or endorsed by TradingView. Read more in the Terms of Use.