
# 🚨 MAHABANK AT A CRITICAL SUPPORT ZONE! ₹73 OR RECOVERY TOWARDS ₹82? 📉
**Bank of Maharashtra (NSE: MAHABANK) | Technical Analysis | 26 October 2026**
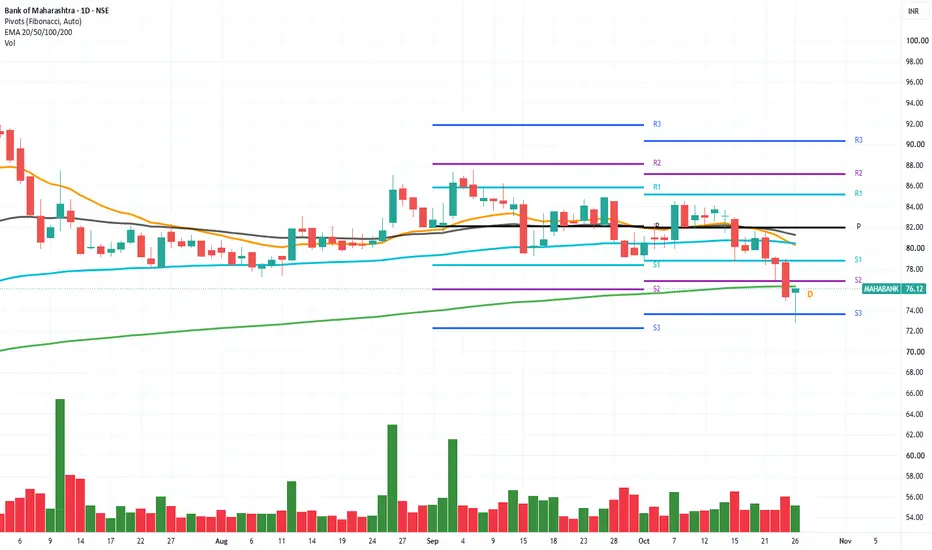
Bank of Maharashtra is showing signs of short-term weakness after falling from its recent highs. The stock is trading at **₹76.12**, below its key short- and medium-term moving averages. However, today's candle shows a recovery from the intraday low of ₹72.77, suggesting buyers emerged at lower levels.
**The key question: Is this the beginning of a recovery, or just a temporary bounce in a downtrend?**
### 📊 KEY SUPPORT & RESISTANCE LEVELS
🟢 **Support Zones**
- **₹76–₹76.30:** Important 200-day EMA area; the stock is testing this broader trend reference.
- **₹73.70–₹74:** First major downside support zone.
- **₹72.20–₹72.80:** Crucial recent low and secondary support.
- **₹69.50–₹70:** Lower support if selling intensifies.
🔴 **Resistance Zones**
- **₹77.70–₹78.00:** Immediate recovery hurdle.
- **₹80–₹82:** Major resistance zone, including the 20-, 50- and 100-day EMA cluster.
- **₹85–₹87:** Higher resistance if the stock manages to recover above ₹82.
- **₹90–₹92:** Major overhead resistance.
*Levels are approximate and may differ across pivot methods and data providers.*
### 🔍 WHAT DO THE INDICATORS SAY?
- **Moving Averages:** Price is below the 20-day EMA (₹80.29), 50-day EMA (₹81.25) and 100-day EMA (₹80.45). The 200-day EMA is around ₹76.28.
- **RSI:** Approximately 34–37 across available technical snapshots, indicating weak momentum and proximity to oversold territory.
- **MACD:** Negative readings suggest bearish momentum remains dominant.
- **Volume:** Approximately 1.38 crore shares traded on 26 October. The rebound followed several weak sessions, but confirmation from subsequent buying is still needed.
- **Candlestick:** The long lower wick and recovery from ₹72.77 suggest buying interest near the lows. A single candle does not confirm a reversal.
- **Volatility:** The recent daily trading range has been significant, so stop-loss and position sizing deserve particular attention.
### 🎯 WHAT COULD HAPPEN NEXT?
✅ **Bullish Scenario**
- The stock holds ₹73.70–₹74 and recovers above ₹78.
- A sustained move above ₹80–₹82 would provide stronger evidence of recovery.
- Higher resistance zones: ₹85–₹87, followed by ₹90–₹92.
⚠️ **Consolidation Scenario**
- The stock remains between ₹74 and ₹80 while momentum stabilises.
- Traders should wait for a clearer directional signal rather than anticipate a breakout.
🔻 **Bearish Scenario**
- A decisive breakdown below ₹73.70 could expose ₹72.20–₹72.80.
- A sustained break below ₹72 would increase the risk of a move towards ₹69.50–₹70.
### 💡 MY TECHNICAL VIEW
**Short-term trend: Bearish. Recovery signal: Not yet confirmed.**
MAHABANK is testing an important longer-term moving-average zone, but its price remains below the shorter moving averages and momentum indicators are weak.
**For traders:** Watch ₹74 support and ₹78 resistance. A recovery above ₹80–₹82 would strengthen the bullish case.
**For investors:** Avoid assuming that a fall towards support automatically creates a buying opportunity. Confirm stabilisation and review the bank's fundamentals alongside the chart.
**Remember:** Support is a zone to observe, not a guarantee that the price will stop falling.
#MAHABANK #BankOfMaharashtra #TechnicalAnalysis #PSUBanks #StockMarketIndia #SupportAndResistance #RSI #MACD #TradingView
*Disclaimer: For educational purposes only. Not a buy/sell recommendation. Verify live prices and manage risk before taking any trading decision.*
**Bank of Maharashtra (NSE: MAHABANK) | Technical Analysis | 26 October 2026**
Bank of Maharashtra is showing signs of short-term weakness after falling from its recent highs. The stock is trading at **₹76.12**, below its key short- and medium-term moving averages. However, today's candle shows a recovery from the intraday low of ₹72.77, suggesting buyers emerged at lower levels.
**The key question: Is this the beginning of a recovery, or just a temporary bounce in a downtrend?**
### 📊 KEY SUPPORT & RESISTANCE LEVELS
🟢 **Support Zones**
- **₹76–₹76.30:** Important 200-day EMA area; the stock is testing this broader trend reference.
- **₹73.70–₹74:** First major downside support zone.
- **₹72.20–₹72.80:** Crucial recent low and secondary support.
- **₹69.50–₹70:** Lower support if selling intensifies.
🔴 **Resistance Zones**
- **₹77.70–₹78.00:** Immediate recovery hurdle.
- **₹80–₹82:** Major resistance zone, including the 20-, 50- and 100-day EMA cluster.
- **₹85–₹87:** Higher resistance if the stock manages to recover above ₹82.
- **₹90–₹92:** Major overhead resistance.
*Levels are approximate and may differ across pivot methods and data providers.*
### 🔍 WHAT DO THE INDICATORS SAY?
- **Moving Averages:** Price is below the 20-day EMA (₹80.29), 50-day EMA (₹81.25) and 100-day EMA (₹80.45). The 200-day EMA is around ₹76.28.
- **RSI:** Approximately 34–37 across available technical snapshots, indicating weak momentum and proximity to oversold territory.
- **MACD:** Negative readings suggest bearish momentum remains dominant.
- **Volume:** Approximately 1.38 crore shares traded on 26 October. The rebound followed several weak sessions, but confirmation from subsequent buying is still needed.
- **Candlestick:** The long lower wick and recovery from ₹72.77 suggest buying interest near the lows. A single candle does not confirm a reversal.
- **Volatility:** The recent daily trading range has been significant, so stop-loss and position sizing deserve particular attention.
### 🎯 WHAT COULD HAPPEN NEXT?
✅ **Bullish Scenario**
- The stock holds ₹73.70–₹74 and recovers above ₹78.
- A sustained move above ₹80–₹82 would provide stronger evidence of recovery.
- Higher resistance zones: ₹85–₹87, followed by ₹90–₹92.
⚠️ **Consolidation Scenario**
- The stock remains between ₹74 and ₹80 while momentum stabilises.
- Traders should wait for a clearer directional signal rather than anticipate a breakout.
🔻 **Bearish Scenario**
- A decisive breakdown below ₹73.70 could expose ₹72.20–₹72.80.
- A sustained break below ₹72 would increase the risk of a move towards ₹69.50–₹70.
### 💡 MY TECHNICAL VIEW
**Short-term trend: Bearish. Recovery signal: Not yet confirmed.**
MAHABANK is testing an important longer-term moving-average zone, but its price remains below the shorter moving averages and momentum indicators are weak.
**For traders:** Watch ₹74 support and ₹78 resistance. A recovery above ₹80–₹82 would strengthen the bullish case.
**For investors:** Avoid assuming that a fall towards support automatically creates a buying opportunity. Confirm stabilisation and review the bank's fundamentals alongside the chart.
**Remember:** Support is a zone to observe, not a guarantee that the price will stop falling.
#MAHABANK #BankOfMaharashtra #TechnicalAnalysis #PSUBanks #StockMarketIndia #SupportAndResistance #RSI #MACD #TradingView
*Disclaimer: For educational purposes only. Not a buy/sell recommendation. Verify live prices and manage risk before taking any trading decision.*

Disclaimer
The information and publications are not meant to be, and do not constitute, financial, investment, trading, or other types of advice or recommendations supplied or endorsed by TradingView. Read more in the Terms of Use.
Disclaimer
The information and publications are not meant to be, and do not constitute, financial, investment, trading, or other types of advice or recommendations supplied or endorsed by TradingView. Read more in the Terms of Use.