
1. The Macro Perspective: The Ascending Triangle Base
I am taking a LONG bias on Marriott International (MAR) on the daily (1D) timeframe.
When analyzing pure market structure on a global hospitality leader, prolonged consolidation patterns are necessary to build kinetic energy for the next major thrust. Following its steady rally throughout late 2025 and early 2026, the stock entered a massive ascending triangle formation. This structure was characterized by a flat overhead resistance ceiling and a rising sequence of higher lows along a dynamic trendline. This pattern successfully absorbed profit-taking and allowed institutional capital to quietly accumulate shares. Fundamentally, this technical momentum aligns perfectly with the company's strong Q1 2026 earnings report, where adjusted diluted EPS came in at $2.72, easily surpassing consensus estimates of $2.58. Furthermore, total revenues reached $6.65 billion, reflecting a 6% year-over-year increase. The company also reported a 4.2% increase in global RevPAR, exceeding expectations driven by strong travel demand.
2. The Educational Setup: Horizontal Resistance and Dynamic Support
To understand the absolute technical validity behind this setup, look closely at how the price structure interacted with its core boundaries right before breaking out:
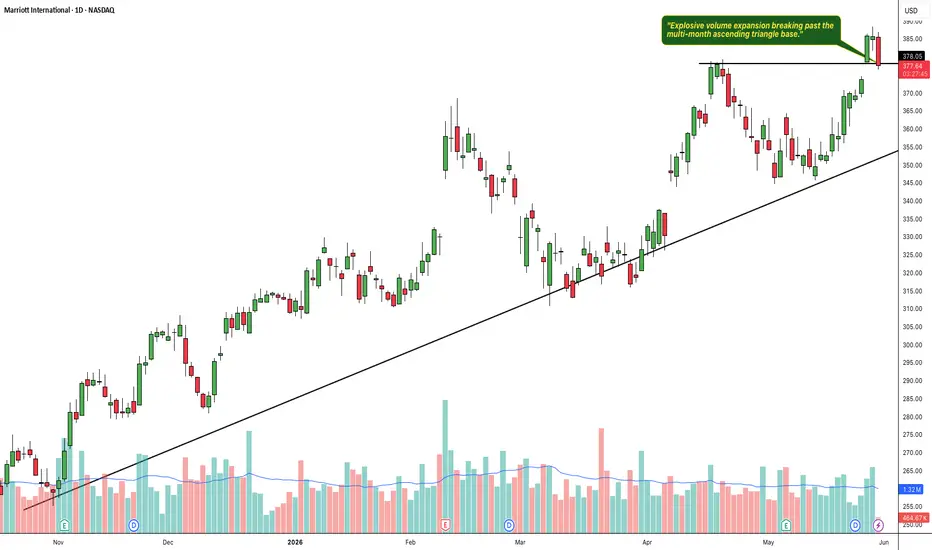
The 378.05 Resistance Ceiling: The definitive line in the sand for a bullish continuation was the solid black horizontal resistance line drawn at 378.05. As the price tested this upper boundary multiple times over the past month, it established a massive supply zone that systematically rejected upward expansion until the recent catalyst.
The Ascending Trendline: During the consolidation block, every deep pullback was heavily defended by institutional buyers at progressively higher levels, forming the solid black diagonal support line. This sequence steadily squeezed volatility directly beneath the breakout zone, building immense structural pressure.
3. Current Price Action: Breakout and Structural Retest
Look at the most recent daily candles on the far right of the chart. The structural pressure cooker exploded. Driven by strong fundamental catalysts, institutional buyers stepped in with undeniable conviction, printing a powerful green expansion candle that decisively obliterated the 378.05 ceiling and pushed the stock to fresh all-time highs near 386.88. The most recent daily candle is a healthy red pullback closing at 376.84, acting as a textbook retest of the breakout zone. The stock is officially attempting to transition out of accumulation and into a highly explosive markup trend into blue-sky territory.
4. The Trade Plan: Entries, Targets, and Risk Management
Entry Strategy: Momentum remains strong despite the recent intraday pullback. The highest-probability, lowest-risk entry strategy involves utilizing this exact current structural retest. Look to scale into long positions right here in the 375.00 to 378.00 zone. Letting old historical resistance prove itself as a concrete new support floor provides an unmatched risk-to-reward ratio before the next leg up.
Take Profit (Targets): We use a classical measured move strategy based on the structural depth of the ascending triangle. By taking the depth of the major range (roughly 30 points from the 348.00 swing low up to the 378.05 ceiling) and projecting it upward from the breakout point, our primary structural target sits comfortably in the 405.00 to 410.00 zone over the coming weeks as pure price discovery continues.
Invalidation (Stop Loss): An ascending triangle breakout thesis is completely invalidated if the price fails to hold its newly claimed structural floor and collapses back inside the core of the base boundaries. A hard stop loss should be placed safely below the diagonal trendline and the recent higher lows, specifically around the 355.00 to 360.00 level. A definitive daily close completely back below 355.00 would act as a severe warning sign of a failed breakout and a major bull trap.
5. Time Horizon:
Because this technical setup is built on a 1-Day chart capturing a clear structural phase transition and an all-time high horizontal breakout, this is a high-alpha swing trade designed to capture a rapid momentum markup phase over the coming weeks. Let the trend run!
I am taking a LONG bias on Marriott International (MAR) on the daily (1D) timeframe.
When analyzing pure market structure on a global hospitality leader, prolonged consolidation patterns are necessary to build kinetic energy for the next major thrust. Following its steady rally throughout late 2025 and early 2026, the stock entered a massive ascending triangle formation. This structure was characterized by a flat overhead resistance ceiling and a rising sequence of higher lows along a dynamic trendline. This pattern successfully absorbed profit-taking and allowed institutional capital to quietly accumulate shares. Fundamentally, this technical momentum aligns perfectly with the company's strong Q1 2026 earnings report, where adjusted diluted EPS came in at $2.72, easily surpassing consensus estimates of $2.58. Furthermore, total revenues reached $6.65 billion, reflecting a 6% year-over-year increase. The company also reported a 4.2% increase in global RevPAR, exceeding expectations driven by strong travel demand.
2. The Educational Setup: Horizontal Resistance and Dynamic Support
To understand the absolute technical validity behind this setup, look closely at how the price structure interacted with its core boundaries right before breaking out:
The 378.05 Resistance Ceiling: The definitive line in the sand for a bullish continuation was the solid black horizontal resistance line drawn at 378.05. As the price tested this upper boundary multiple times over the past month, it established a massive supply zone that systematically rejected upward expansion until the recent catalyst.
The Ascending Trendline: During the consolidation block, every deep pullback was heavily defended by institutional buyers at progressively higher levels, forming the solid black diagonal support line. This sequence steadily squeezed volatility directly beneath the breakout zone, building immense structural pressure.
3. Current Price Action: Breakout and Structural Retest
Look at the most recent daily candles on the far right of the chart. The structural pressure cooker exploded. Driven by strong fundamental catalysts, institutional buyers stepped in with undeniable conviction, printing a powerful green expansion candle that decisively obliterated the 378.05 ceiling and pushed the stock to fresh all-time highs near 386.88. The most recent daily candle is a healthy red pullback closing at 376.84, acting as a textbook retest of the breakout zone. The stock is officially attempting to transition out of accumulation and into a highly explosive markup trend into blue-sky territory.
4. The Trade Plan: Entries, Targets, and Risk Management
Entry Strategy: Momentum remains strong despite the recent intraday pullback. The highest-probability, lowest-risk entry strategy involves utilizing this exact current structural retest. Look to scale into long positions right here in the 375.00 to 378.00 zone. Letting old historical resistance prove itself as a concrete new support floor provides an unmatched risk-to-reward ratio before the next leg up.
Take Profit (Targets): We use a classical measured move strategy based on the structural depth of the ascending triangle. By taking the depth of the major range (roughly 30 points from the 348.00 swing low up to the 378.05 ceiling) and projecting it upward from the breakout point, our primary structural target sits comfortably in the 405.00 to 410.00 zone over the coming weeks as pure price discovery continues.
Invalidation (Stop Loss): An ascending triangle breakout thesis is completely invalidated if the price fails to hold its newly claimed structural floor and collapses back inside the core of the base boundaries. A hard stop loss should be placed safely below the diagonal trendline and the recent higher lows, specifically around the 355.00 to 360.00 level. A definitive daily close completely back below 355.00 would act as a severe warning sign of a failed breakout and a major bull trap.
5. Time Horizon:
Because this technical setup is built on a 1-Day chart capturing a clear structural phase transition and an all-time high horizontal breakout, this is a high-alpha swing trade designed to capture a rapid momentum markup phase over the coming weeks. Let the trend run!
Trade closed: target reached
Target already achieved.
Disclaimer
The information and publications are not meant to be, and do not constitute, financial, investment, trading, or other types of advice or recommendations supplied or endorsed by TradingView. Read more in the Terms of Use.
Disclaimer
The information and publications are not meant to be, and do not constitute, financial, investment, trading, or other types of advice or recommendations supplied or endorsed by TradingView. Read more in the Terms of Use.