
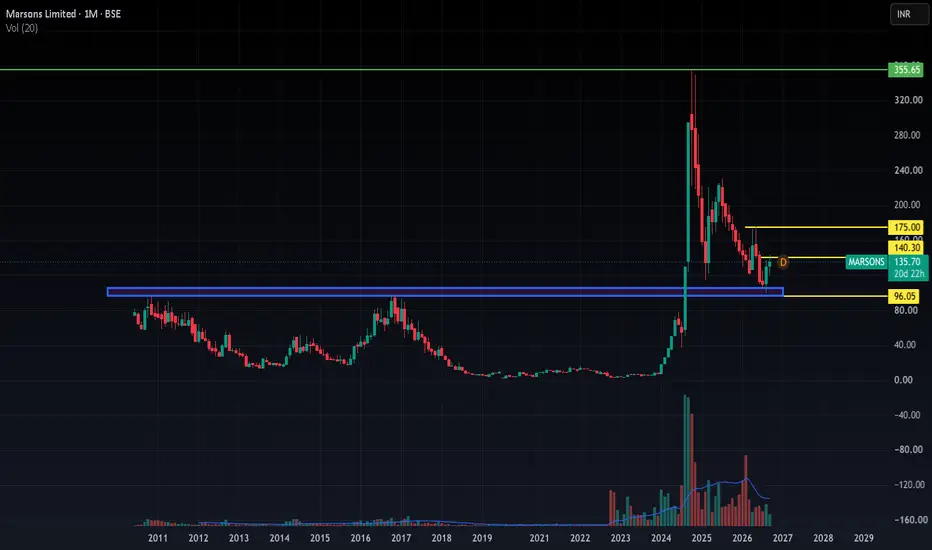
Support and Resistance with historical chart. Chart can trace back historical resistance and take support from there. In this example we can see how it support at 99 in 2010 and 2016
Note
This is for education purposes only and I am not a SEBI registered. Do your own research before investing. 
Disclaimer
The information and publications are not meant to be, and do not constitute, financial, investment, trading, or other types of advice or recommendations supplied or endorsed by TradingView. Read more in the Terms of Use.
Disclaimer
The information and publications are not meant to be, and do not constitute, financial, investment, trading, or other types of advice or recommendations supplied or endorsed by TradingView. Read more in the Terms of Use.