
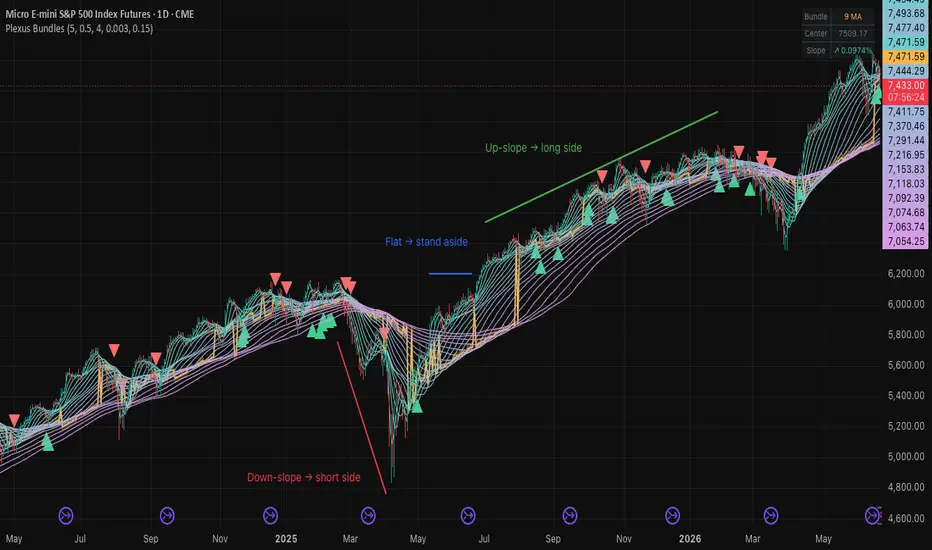
Micro E-mini S&P 500 (MES), daily. A "bundle" is a cluster of moving averages converged into one band — its slope reads which side of the market the structure is on
• Jul 2025–Feb 2026 — bundle slopes up, price rides above it: the long side of a clean trend
• Feb–Apr 2025 — bundle turns down, price drops through it: the short side
• May–Jul 2025 — bundle goes flat and tangled, price chops sideways: no side, stand aside
Where it works: it reads the side and the regime well when structure is trending. Where it lies: in the flat stretch it whips — knowing to wait there is the skill, not forcing a trade.
It won't hand you a precise entry, and I wouldn't trust anything that claims to. Use it to read the side and filter your own setups. Educational, not a signal — not financial advice
• Jul 2025–Feb 2026 — bundle slopes up, price rides above it: the long side of a clean trend
• Feb–Apr 2025 — bundle turns down, price drops through it: the short side
• May–Jul 2025 — bundle goes flat and tangled, price chops sideways: no side, stand aside
Where it works: it reads the side and the regime well when structure is trending. Where it lies: in the flat stretch it whips — knowing to wait there is the skill, not forcing a trade.
It won't hand you a precise entry, and I wouldn't trust anything that claims to. Use it to read the side and filter your own setups. Educational, not a signal — not financial advice

Disclaimer
The information and publications are not meant to be, and do not constitute, financial, investment, trading, or other types of advice or recommendations supplied or endorsed by TradingView. Read more in the Terms of Use.
Disclaimer
The information and publications are not meant to be, and do not constitute, financial, investment, trading, or other types of advice or recommendations supplied or endorsed by TradingView. Read more in the Terms of Use.