
This post is educational and observational in nature based on historical price action. It is not a forecast or a trading recommendation.
Flip Zone (Green)
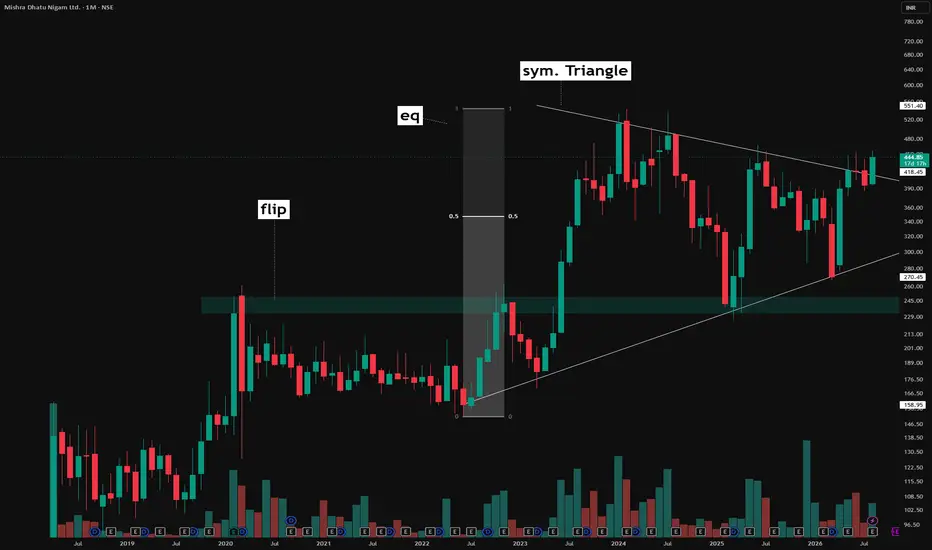
A price level that once acted as resistance and, after being broken and sustained above, converted into support. This shift in role is what defines a flip zone.
Equilibrium Point
The midpoint calculated between the biggest swing low and the biggest swing high on the chart. This level divides the overall range into two equal halves and is often used as a reference point to gauge whether price is trading in the upper or lower half of a larger structural move.
Symmetrical Triangle Pattern
A consolidation pattern formed between converging lower highs and higher lows, compressing into a tighter range over time. In this case, the pattern formed directly between the flip zone and the equilibrium point, sitting within that broader structural context rather than in isolation.
The Bigger Picture
This chart brings together three layers of context, a flip zone marking a change in level behavior, an equilibrium point marking the midpoint of the larger swing, and a symmetrical triangle forming in the space between them. Studying where a pattern forms relative to the broader range it sits within, rather than looking at the pattern alone, offers a much deeper read of the chart's structure.
Flip Zone (Green)
A price level that once acted as resistance and, after being broken and sustained above, converted into support. This shift in role is what defines a flip zone.
Equilibrium Point
The midpoint calculated between the biggest swing low and the biggest swing high on the chart. This level divides the overall range into two equal halves and is often used as a reference point to gauge whether price is trading in the upper or lower half of a larger structural move.
Symmetrical Triangle Pattern
A consolidation pattern formed between converging lower highs and higher lows, compressing into a tighter range over time. In this case, the pattern formed directly between the flip zone and the equilibrium point, sitting within that broader structural context rather than in isolation.
The Bigger Picture
This chart brings together three layers of context, a flip zone marking a change in level behavior, an equilibrium point marking the midpoint of the larger swing, and a symmetrical triangle forming in the space between them. Studying where a pattern forms relative to the broader range it sits within, rather than looking at the pattern alone, offers a much deeper read of the chart's structure.

📊Swing & positional research with Buy, Sell & Hold recommendations
Contact for NOVEMBER SLOTS
📞WhatsApp ( Pro ): wa.me/919455664601
📢Free Picks on Telegram ( Join ) : t.me/hashtaghammer
Apoorv Dubey|SEBI RA INH000030287
Contact for NOVEMBER SLOTS
📞WhatsApp ( Pro ): wa.me/919455664601
📢Free Picks on Telegram ( Join ) : t.me/hashtaghammer
Apoorv Dubey|SEBI RA INH000030287
Related publications
Disclaimer
The information and publications are not meant to be, and do not constitute, financial, investment, trading, or other types of advice or recommendations supplied or endorsed by TradingView. Read more in the Terms of Use.
📊Swing & positional research with Buy, Sell & Hold recommendations
Contact for NOVEMBER SLOTS
📞WhatsApp ( Pro ): wa.me/919455664601
📢Free Picks on Telegram ( Join ) : t.me/hashtaghammer
Apoorv Dubey|SEBI RA INH000030287
Contact for NOVEMBER SLOTS
📞WhatsApp ( Pro ): wa.me/919455664601
📢Free Picks on Telegram ( Join ) : t.me/hashtaghammer
Apoorv Dubey|SEBI RA INH000030287
Related publications
Disclaimer
The information and publications are not meant to be, and do not constitute, financial, investment, trading, or other types of advice or recommendations supplied or endorsed by TradingView. Read more in the Terms of Use.