
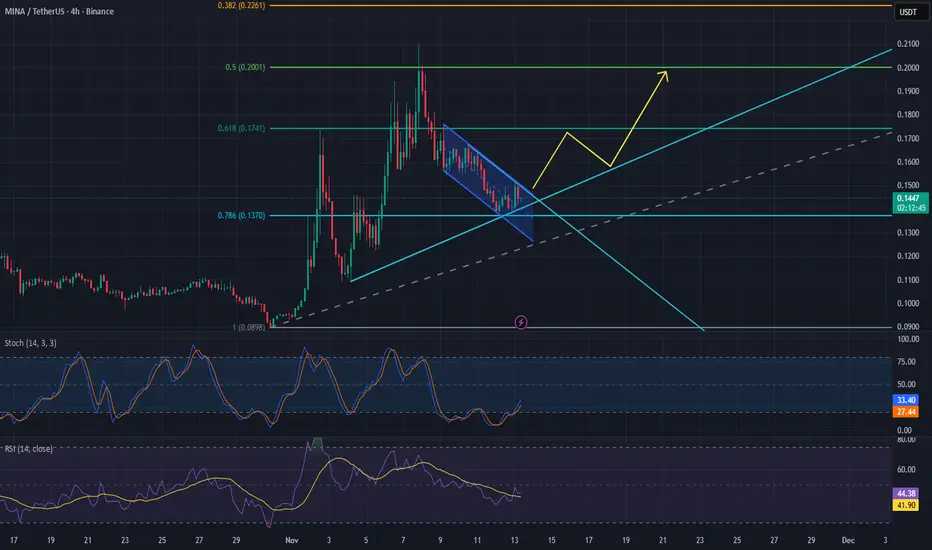
MINA is currently trading around the 0.144–0.145 USDT area, showing signs of a potential breakout from a descending channel after a healthy correction from the recent high.
Key highlights:
Fibonacci retracement from 0.0898 → 0.2098 shows price holding above the 0.786 (0.1370) support level.
Price is attempting to break above the descending channel, aligning with a possible trendline retest.
RSI and Stochastic RSI are both recovering from oversold zones, suggesting building bullish momentum.
A confirmed breakout could push MINA towards 0.165 (Fib 0.618) and then 0.20 (Fib 0.5) as the next resistance levels.
📈 Bullish scenario: Breakout and retest of the channel could trigger an upward continuation toward 0.165 → 0.200.
📉 Bearish scenario: Failure to hold above 0.137 could invalidate this setup and send price back to 0.120–0.118 support zone.
Idea: Watching for breakout confirmation above the channel for a potential long setup.
Timeframe: 4H
Trend bias: Neutral → Bullish
Key highlights:
Fibonacci retracement from 0.0898 → 0.2098 shows price holding above the 0.786 (0.1370) support level.
Price is attempting to break above the descending channel, aligning with a possible trendline retest.
RSI and Stochastic RSI are both recovering from oversold zones, suggesting building bullish momentum.
A confirmed breakout could push MINA towards 0.165 (Fib 0.618) and then 0.20 (Fib 0.5) as the next resistance levels.
📈 Bullish scenario: Breakout and retest of the channel could trigger an upward continuation toward 0.165 → 0.200.
📉 Bearish scenario: Failure to hold above 0.137 could invalidate this setup and send price back to 0.120–0.118 support zone.
Idea: Watching for breakout confirmation above the channel for a potential long setup.
Timeframe: 4H
Trend bias: Neutral → Bullish

Disclaimer
The information and publications are not meant to be, and do not constitute, financial, investment, trading, or other types of advice or recommendations supplied or endorsed by TradingView. Read more in the Terms of Use.
Disclaimer
The information and publications are not meant to be, and do not constitute, financial, investment, trading, or other types of advice or recommendations supplied or endorsed by TradingView. Read more in the Terms of Use.