
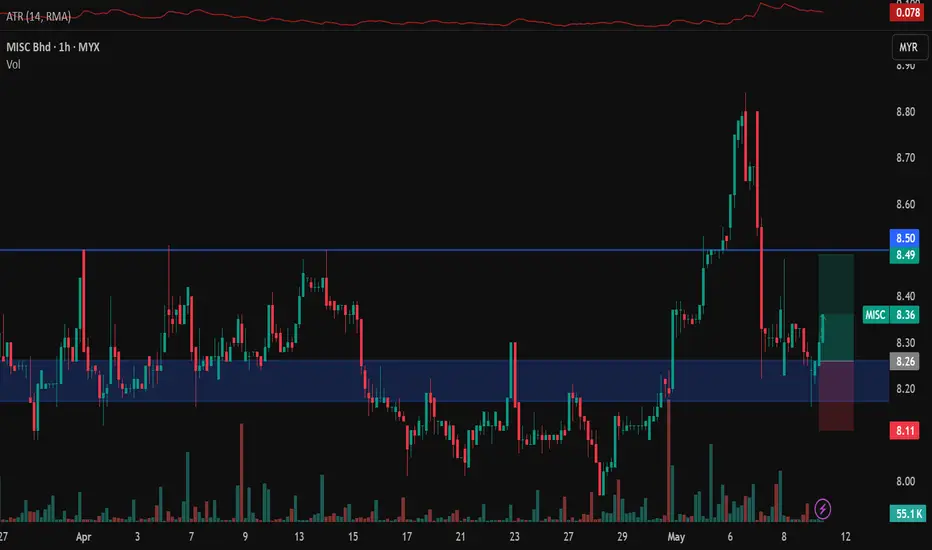
Price broke a multi-month level with high volume on the move leading towards the breakout on the 4hr chart. Then on the pullback, big large candles formed but with low volume signalling the strength during the move down wasn't because of the bearish volume but lack of buying pressure. On the 1hr chart, a double bottom formed and entry is on the green candle at the second bottom. Stops is below the lows and tp is before the next resistance level.

Disclaimer
The information and publications are not meant to be, and do not constitute, financial, investment, trading, or other types of advice or recommendations supplied or endorsed by TradingView. Read more in the Terms of Use.
Disclaimer
The information and publications are not meant to be, and do not constitute, financial, investment, trading, or other types of advice or recommendations supplied or endorsed by TradingView. Read more in the Terms of Use.