
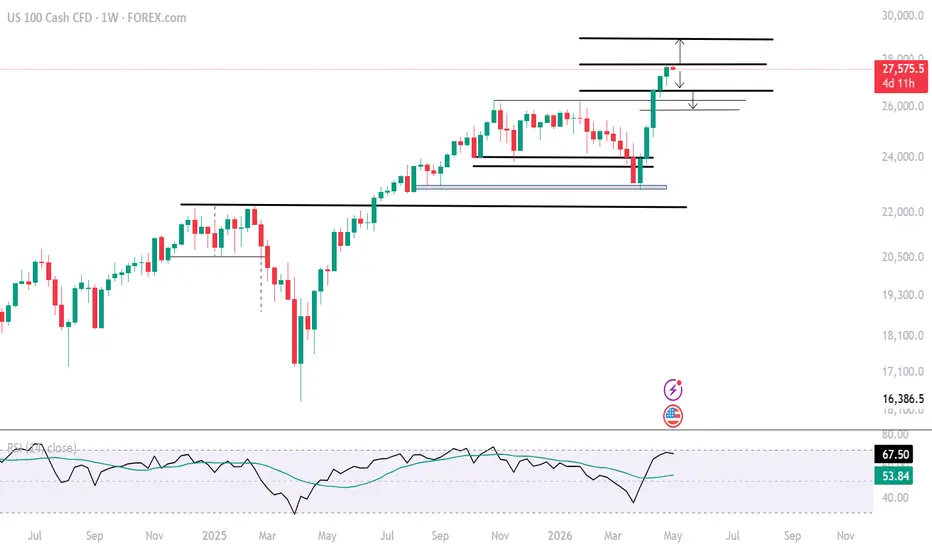
From a weekly perspective, Nasdaq momentum is showing signs of slowing near overbought levels, similar to prior peaks seen in 2024 and 2025. This raises the risk of a pullback or momentum unwind as markets realize the Q2 pressure from Hormuz-related risks over Q1 earnings.
Key levels to watch, derived using Fibonacci extensions between the April 2025 lows, October 2025 highs, and April 2026 lows, are:
27,800 (0.5)
28,900 (0.618)
30,660 (0.786)
On the downside, a break below 26,900 would reinforce a pullback toward 26,300, 26,100, and 25800, levels representing potential rebound opportunities
Written by Razan Hilal, CMT

Disclaimer
The information and publications are not meant to be, and do not constitute, financial, investment, trading, or other types of advice or recommendations supplied or endorsed by TradingView. Read more in the Terms of Use.
Disclaimer
The information and publications are not meant to be, and do not constitute, financial, investment, trading, or other types of advice or recommendations supplied or endorsed by TradingView. Read more in the Terms of Use.