
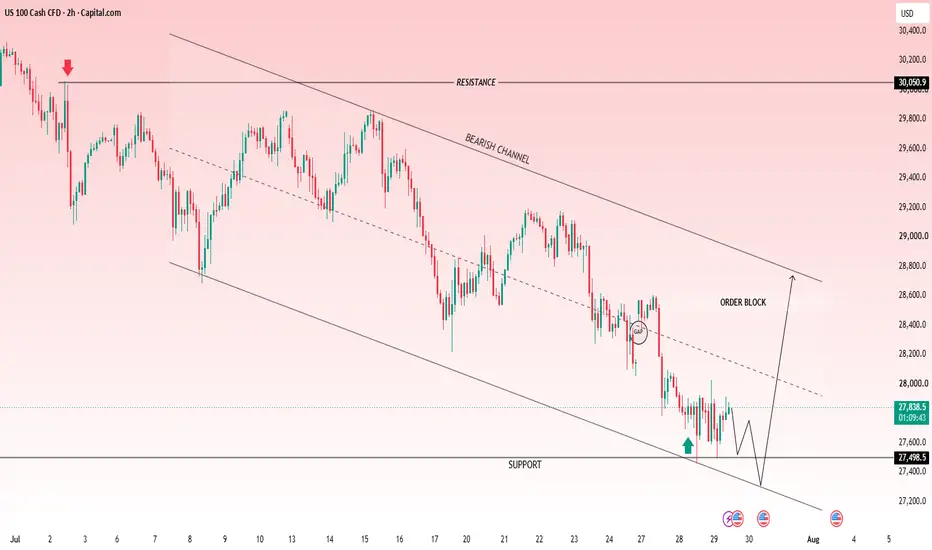
📉 US100 (NASDAQ) Technical Analysis – Bearish Structure in Focus 🔥
The US100 remains under strong bearish pressure, trading inside a well-defined descending channel. Price is hovering just above a major support zone around 27,500, where buyers are attempting to defend the level.
🧠 Market Structure
📉 Overall trend remains bearish below the descending trendline.
🛑 A previous order block near 28,450–28,600 is acting as strong resistance.
⚠️ A gap/FVG has been left behind, which may attract a short-term retracement before the next move.
🎯 The marked support is the key decision zone for the next breakout.
📊 Trading Outlook
🔻 Bearish Scenario (Preferred):
A confirmed break below 27,500 could accelerate selling.
🎯 Targets:
TP1: 27,300
TP2: 27,000
TP3: 26,600
🟢 Bullish Recovery Scenario:
If support holds, expect a relief rally toward the 28,450–28,600 Order Block.
A breakout above that area would weaken the bearish outlook.
⚡ Conclusion
📌 The trend remains bearish until price breaks above the descending channel and order block resistance. Watch 27,500 closely—it is the key level that will likely determine the next major move. 🚀📉
Trade active
📈 **The setup is playing out exactly as expected—price is steadily advancing toward the take-profit target. 🎯**

✦ MARKET STRATEGY SIGNALS ✦ 📊
Smart Money • Price Action • Precision • good entries
📲 Join Telegram: t.me/marketstrategyentry
Smart Money • Price Action • Precision • good entries
📲 Join Telegram: t.me/marketstrategyentry
Related publications
Disclaimer
The information and publications are not meant to be, and do not constitute, financial, investment, trading, or other types of advice or recommendations supplied or endorsed by TradingView. Read more in the Terms of Use.